

SITCOMTN-124
Metrics and Plots Available in ComCam On-Sky Data#
Abstract
This technote explores the metrics/plots generated by the LSST Science Pipelines for Data Preview 1.
We describe the methods used to aggregate these plots and metrics, list metrics and plots created by each task, and provide examples of each metricBundle / Plot produced.
Intro#
This document was originally created as part of the Operations Rehearsal 3 and updated during the preparation of Data Preview 1. It is not intended to be a definitive source/documentation for plots and metrics. Instead, the hope is that this document can help others learn how to determine what plots/metrics exist and how to access them.
To facilitate this we describe the methods we used to find, access and understand the data products created when running the data reduction pipeline (DRP). This incudes:
The tasks and configuration used to generate these metrics/plots
How to retrieve plots in the notebook aspect of the Rubin Science Platform
Then we list out the tasks in the Nightly Validation Pipeline that generate metrics and plots.
For each task we link the pipeline yaml that configures the task (tagged to w_2025_04) and examples of the metricMeasurementBundles and Plots created by each task.
This should allow for a quick exploration of the data products produced as a part of this pipeline.
For each metricBundle we list an example dataId used, the metricBundle’s name, its atools docstring, any additional notes, and an example result.
We split these into Visit-level metrics and Tract-level metrics.
Finally, for each plot datasetType we show an example version of the plot, again split into Visit-level plots and Tract-level metrics.
The code used to generate the plots and figures for this technote can be found in the notebook atools_metrics_plots_census.ipynb
Finding and accessing data products#
In this section we describe the ways we determined which metrics and plots were created by the Data Release Processing (DRP) runs.
For more information on how metrics and plots are created or how to run your own pipeline see the tutorial in the analysis_tools documentation.
Which collections to use#
The data reduction campaigns are listed in the “LSSTComCam Intermittent Cumulative DRP Runs” confluence page. On that page we can see the following information for the collection containing the w_2025_04 intermittent cumulative DRP reductions:
repo = /repo/main
collection = LSSTComCam/runs/DRP/DP1/w_2025_04/DM-48556
What tools/metrics/plots exist#
To see what metrics exist in a given butler collection (note that this assumes the butler has been initialized with the desired repo, the registry extracted via registry = butler.registry, and the collection name assigned to the variable collection), execute the following. This code block finds all datasetTypes with storageClass of MetricMeasurementBundle.
metrics_datasets = []

for datasetType in registry.queryDatasetTypes():
    if registry.queryDatasets(datasetType, collections=collection).any(execute=False, exact=False):
        if datasetType.storageClass_name == 'MetricMeasurementBundle':
            print(datasetType)
            metrics_datasets.append(datasetType)
A similar query with MetricMeasurementBundle replaced by Plot will show you all of the plot datasetTypes that have been defined for the given repo/collection. Some examples are shown below:
DatasetType('matchedVisitCore_metrics', {instrument, skymap, tract}, MetricMeasurementBundle)
DatasetType('matchedVisitCore_g_stellarAstrometricResidualStdDevDec_FocalPlanePlot', {instrument, skymap, tract}, Plot)
DatasetType('preSourceTableCore_skySourceFlux_HistPlot', {band, instrument, physical_filter, visit}, Plot)
DatasetType('objectTableExtended_r_ap12PsfSky_SkyPlot', {skymap, tract}, Plot)
This query compiles a list of datasetType objects, which include the butler dimensions necessary to retrieve the dataset (the items included within the curly braces above; for example, to retrieve matchedVisitCore_metrics from the butler, one would need to specify the desired instrument, skymap, and tract in the dataId passed to the butler). An example of how to retrieve one of these:
did_tract = {'tract': 5063, 'skymap': 'lsst_cells_v1', 'band': 'g', 'instrument': 'LSSTComCam'}

matchedVisitCoreMetrics = butler.get('matchedVisitCore_metrics', dataId=did_tract, collections=collection)
What was configured and run in the pipeline#
Consider the following pipeline task definition for analyzePreSourceTableCore:
  analyzePreSourceTableCore:
    class: lsst.analysis.tools.tasks.SourceTableVisitAnalysisTask
    config:
      connections.outputName: preSourceTableCore
      atools.skyFluxVisitStatisticMetric: SkyFluxStatisticMetric
      atools.skyFluxVisitStatisticMetric.applyContext: VisitContext
      atools.skySourceSky: SkySourceSkyPlot
      atools.skySourceFlux: SkySourceHistPlot
      python: |
        from lsst.analysis.tools.atools import *
        from lsst.analysis.tools.contexts import *
In a pipeline task definition (e.g., analyzePreSourceTableCore), the output will be called
{connections.outputName}_metricsfor metric bundles, and{connections.outputName}_atool.name_plotTypefor plots
An example from the above config file:
{connections.outputName}=preSourceTableCoreatool.name=SkySourceSkyPlotplotType=SkyPlot
will produce the datasetType preSourceTableCore_SkySourceSky_SkyPlot.
In the pipeline for nightly validation, analyzePreSourceTableCore is defined as:
imports:
  - $DRP_PIPE_DIR/pipelines/LSSTComCamSim/DRP-ops-rehearsal-3.yaml
tasks:
  analyzePreSourceTableCore:
    class: lsst.analysis.tools.tasks.SourceTableVisitAnalysisTask
    config:
      connections.data: preSourceTable_visit
      connections.inputName: preSourceTable_visit
      connections.outputName: preSourceTableCore
This slightly reconfigures the version of “analyzePreSourceTableCore” that is imported from DRP-ops-rehearsal-3.yaml, which in turn imports from pipelines/_ingredients. The reconfiguration simply changes the input dataset.
Extracting the exact configuration from butler#
Above we described the general way to see which tasks were run and how they were configured, but given a specific task there is an associated configuration file in the butler.
For example, for the analyzePreSourceTableCore task there is a configuration file with the datasetType of analyzePreSourceTableCore_config that can be obtained with butler.get and shows the exact configuration of the task.
Retrieving plots from the butler#
A quick test in a notebook will show that you cannot use butler.get to retrieve plots from the butler. To retrieve them, you will instead use the butler.retrieveArtifacts method. If you know the name of the plot dataset you wish to retrieve, an appropriate dataId, the butler has been initialized with the desired repo and the registry extracted via registry = butler.registry, and the collection name assigned to the variable collection, you can use:
plot_name = 'preSourceTableCore_skySourceFlux_HistPlot'
output_filepath = './plots/'
plot_dataset = registry.queryDatasets(plot_name, dataId=dataId)
butler.retrieveArtifacts(plot_dataset, output_filepath,
                         preserve_path=False, overwrite=True)
The two required inputs for butler.retrieveArtifacts are an iterable of DatasetRefs (in this case, obtained using registry.queryDatasets) and the path to the output destination. If you set the optional keyword preserve_path to False, the files will simply be placed in the destination directory. If this is left at its default value of True, the original path will be retained (and will contain many deeply-nested directories). Note also that overwrite=False by default.
A less optimal workaround is to retrieve the plot using:
plot_name = 'preSourceTableCore_skySourceFlux_HistPlot'
ref = butler.registry.findDataset(plot_name, dataId, collections=collections)
uri = butler.getURI(ref)
image_bytes = uri.read()
Then it can be saved (though it is preferable to use butler.retrieveArtifacts for that purpose):
file_name= uri.basename()
with open(file_name, 'wb') as file:
  file.write(image_bytes)
or displayed in a notebook:
from IPython.display import Image
Image(image_bytes)
Nightly validation pipeline#
The nightly validation pipeline described here was run during Operations Rehearsal 3.
Visit-level tasks#
This table has 3 columns: Task, datasetType, and StorageClass. The task entry links to the pipeline yaml responsible for the task configuration. The datasetType links to either a description of the metric bundle or an example plot generated as part of the nightly validation run. The StorageClass is either Plot or MetricMeasurementBundle.
Task (link to pipeline yaml) |
datasetType |
StorageClass |
|---|---|---|
MetricMeasurementBundle |
||
MetricMeasurementBundle |
||
matchedvisitcore-{band}-stellarphotometricrepeatability-histplot |
Plot |
|
matchedvisitcore-{band}-stellarastrometricresidualstddevra-focalplaneplot |
Plot |
|
matchedvisitcore-{band}-stellarphotometricresiduals-focalplaneplot |
Plot |
|
matchedvisitcore-{band}-stellarastrometricresidualsdec-focalplaneplot |
Plot |
|
matchedvisitcore-{band}-stellarastrometricresidualsra-focalplaneplot |
Plot |
|
matchedvisitcore-{band}-stellarastrometricresidualstddevdec-focalplaneplot |
Plot |
|
matchedvisitcore-{band}-stellarastrometricrepeatability2-histplot |
Plot |
|
matchedvisitcore-{band}-stellarastrometricrepeatability1-histplot |
Plot |
|
matchedvisitcore-{band}-stellarastrometricrepeatability3-histplot |
Plot |
|
matchedvisitcore-{band}-stellarastrometricselfrepeatabilitydec-histplot |
Plot |
|
matchedvisitcore-{band}-stellarastrometricselfrepeatabilityra-histplot |
Plot |
|
MetricMeasurementBundle |
||
Plot |
||
Tract-level tasks#
Visit-level metrics#
Below we list out the metrics associated with each metric bundle at a visit level.
calexpSummary_metrics#
dataId used in examples:
did_visit_det = {'visit':7024040300001, 'skymap':'ops_rehersal_prep_2k_v1', 'instrument':'LSSTComCamSim', 'detector':0}
metricBundle: calexpSummaryMetrics (source)
Docstring: Calibrated exposure summary statistics to load from the butler
Notes: These metrics are computed outside of analysis_tools in the computeExposureSummaryStats pipetask (source),
which has the following docstring: Task to compute exposure summary statistics.
This task computes various quantities suitable for DPDD and other downstream processing at the detector centers, including:
psfSigma
psfArea
psfIxx
psfIyy
psfIxy
ra
dec
zenithDistance
zeroPoint
skyBg
skyNoise
meanVar
raCorners
decCorners
astromOffsetMean
astromOffsetStd
These additional quantities are computed from the stars in the detector:
psfStarDeltaE1Median
psfStarDeltaE2Median
psfStarDeltaE1Scatter
psfStarDeltaE2Scatter
psfStarDeltaSizeMedian
psfStarDeltaSizeScatter
psfStarScaledDeltaSizeScatter
These quantities are computed based on the PSF model and image mask to assess the robustness of the PSF model across a given detector (against, e.g., extrapolation instability):
maxDistToNearestPsf
psfTraceRadiusDelta
These quantities are computed to assess depth:
effTime
effTimePsfSigmaScale
effTimeSkyBgScale
effTimeZeroPointScale
metric name |
value |
units |
|---|---|---|
psfSigma |
1.506499 |
pix |
psfArea |
34.678724 |
|
psfIxx |
2.258628 |
pix |
psfIyy |
2.281597 |
pix |
psfIxy |
0.049743 |
pix |
ra |
124.617999 |
deg |
dec |
-15.026213 |
deg |
zenithDistance |
17.825242 |
deg |
zeroPoint |
31.271871 |
mag |
skyBg |
1703.767764 |
mag |
skyNoise |
34.471789 |
mag |
meanVar |
1175.081472 |
mag |
astromOffsetMean |
0.005423 |
arcsec |
astromOffsetStd |
0.003085 |
arcsec |
nPsfStar |
419.000000 |
|
psfStarDeltaE1Median |
-0.000103 |
pix |
psfStarDeltaE2Median |
-0.000645 |
pix |
psfStarDeltaE1Scatter |
0.008924 |
pix |
psfStarDeltaE2Scatter |
0.009482 |
pix |
psfStarDeltaSizeMedian |
0.000991 |
pix |
psfStarDeltaSizeScatter |
0.007213 |
pix |
psfStarScaledDeltaSizeScatter |
0.004785 |
pix |
psfTraceRadiusDelta |
0.012334 |
pix |
maxDistToNearestPsf |
419.527519 |
deg |
effTime |
12.083753 |
s |
effTimePsfSigmaScale |
1.127983 |
s |
effTimeSkyBgScale |
0.344765 |
s |
effTimeZeroPointScale |
1.035749 |
s |
matchedVisitCore_metrics#
dataId used in examples:
did_tract = {'tract':5063, 'skymap': 'lsst_cells_v1', 'band': 'g', 'instrument':'LSSTComCam'}
These metrics are for a set of “matched visits,” which is created by taking all objects from the isolated_star_sources table in a given tract, then matching all of the sourceTable catalogs to accumulate all measurements for each source. These collections can be used for repeatability measurements.
Note that although these metrics use information from individual visits, their Butler dimension is tract because they aggregate measurements from all visits contributing to a tract.
metricBundle: stellarAstrometricRepeatability1 (source)
Docstring: Calculate the AMx, ADx, AFx metrics and make histograms showing the data used to compute the metrics.
Notes: AMx, ADx, and AFx (where x=[1, 2, 3]) are defined in the Observatory System Specifications (OSS) as requirement OSS-REQ-0388. AMx is a measure of astrometric repeatability on xx arcminute scales, where xx=[5, 20, 200] for x=[1, 2, 3]. ADx defines thresholds for outliers, and AFx captures the percentage of outliers exceeding the ADx outlier limit.
Defined with signal-to-noise (S/N) cuts of 50 < S/N < 50000 and a magnitude range of 17 < mag < 21.5.
stellarAstrometricRepeatability1 measures repeatability on 5 arcminute scales.
metric name |
value |
units |
|---|---|---|
u_AM1 |
16.649138 |
mas |
u_AF1 |
22.201517 |
% |
u_AD1 |
28.129798 |
mas |
g_AM1 |
15.628324 |
mas |
g_AF1 |
24.470774 |
% |
g_AD1 |
30.426507 |
mas |
r_AM1 |
13.416911 |
mas |
r_AF1 |
13.611736 |
% |
r_AD1 |
22.404970 |
mas |
i_AM1 |
12.607847 |
mas |
i_AF1 |
11.067706 |
% |
i_AD1 |
20.722490 |
mas |
z_AM1 |
12.461857 |
mas |
z_AF1 |
11.519684 |
% |
z_AD1 |
21.046111 |
mas |
y_AM1 |
12.761201 |
mas |
y_AF1 |
12.620278 |
% |
y_AD1 |
21.692446 |
mas |
metricBundle: stellarAstrometricRepeatability2 (source)
Docstring: Calculate the AMx, ADx, AFx metrics and make histograms showing the data used to compute the metrics.
Notes: stellarAstrometricRepeatability2 measures repeatability on 20 arcminute scales.
metric name |
value |
units |
|---|---|---|
u_AM2 |
15.659163 |
mas |
u_AF2 |
20.873564 |
% |
u_AD2 |
27.267193 |
mas |
g_AM2 |
14.838544 |
mas |
g_AF2 |
23.823734 |
% |
g_AD2 |
30.171673 |
mas |
r_AM2 |
12.428093 |
mas |
r_AF2 |
11.682237 |
% |
r_AD2 |
21.131835 |
mas |
i_AM2 |
11.615206 |
mas |
i_AF2 |
9.139840 |
% |
i_AD2 |
19.391778 |
mas |
z_AM2 |
11.338962 |
mas |
z_AF2 |
9.349920 |
% |
z_AD2 |
19.546127 |
mas |
y_AM2 |
11.638790 |
mas |
y_AF2 |
10.039435 |
% |
y_AD2 |
20.025457 |
mas |
metricBundle: stellarAstrometricRepeatability3 (source)
Docstring: Calculate the AMx, ADx, AFx metrics and make histograms showing the data used to compute the metrics.
Notes: stellarAstrometricRepeatability3 measures repeatability on 200 arcminute scales. There are no measurements for these metrics currently, because we do not have datasets spanning the requisite 200-arcminute scale.
metric name |
value |
units |
|---|---|---|
u_AM3 |
nan |
mas |
u_AF3 |
nan |
% |
u_AD3 |
nan |
mas |
g_AM3 |
nan |
mas |
g_AF3 |
nan |
% |
g_AD3 |
nan |
mas |
r_AM3 |
nan |
mas |
r_AF3 |
nan |
% |
r_AD3 |
nan |
mas |
i_AM3 |
nan |
mas |
i_AF3 |
nan |
% |
i_AD3 |
nan |
mas |
z_AM3 |
nan |
mas |
z_AF3 |
nan |
% |
z_AD3 |
nan |
mas |
y_AM3 |
nan |
mas |
y_AF3 |
nan |
% |
y_AD3 |
nan |
mas |
metricBundle: stellarAstrometricSelfRepeatabilityDec (source)
Docstring: Calculate the median position RMS of point sources.
Notes: The median of the per-source RMS positional scatter in Declination. Defined with a magnitude selection of 17 < mag < 21.5.
metric name |
value |
units |
|---|---|---|
u_dmL2AstroErr_Dec |
15.141275 |
mas |
g_dmL2AstroErr_Dec |
9.422350 |
mas |
r_dmL2AstroErr_Dec |
9.224946 |
mas |
i_dmL2AstroErr_Dec |
8.756453 |
mas |
z_dmL2AstroErr_Dec |
10.908766 |
mas |
y_dmL2AstroErr_Dec |
10.780756 |
mas |
metricBundle: stellarAstrometricSelfRepeatabilityRA (source)
Docstring: Calculate the median position RMS of point sources.
Notes: The median of the per-source RMS positional scatter in Right Ascension. Defined with a magnitude selection of 17 < mag < 21.5.
metric name |
value |
units |
|---|---|---|
u_dmL2AstroErr_RA |
16.201780 |
mas |
g_dmL2AstroErr_RA |
15.396698 |
mas |
r_dmL2AstroErr_RA |
10.670404 |
mas |
i_dmL2AstroErr_RA |
10.214307 |
mas |
z_dmL2AstroErr_RA |
11.032055 |
mas |
y_dmL2AstroErr_RA |
11.842188 |
mas |
metricBundle: stellarPhotometricRepeatability (source)
Docstring: Compute photometric repeatability from multiple measurements of a set of stars. First, a set of per-source quality criteria are applied. Second, the individual source measurements are grouped together by object index and per-group quantities are computed (e.g., a representative S/N for the group based on the median of associated per-source measurements). Third, additional per-group criteria are applied. Fourth, summary statistics are computed for the filtered groups.
Notes: The median and outlier fraction of the per-source RMS magnitude scatter. Defined for stars with S/N > 200. Metrics with “stellarPhotRepeatStdev” in their names correspond to PA1 defined in the OSS as requirement OSS-REQ-0387. Metrics with “stellarPhotRepeatOutlierFraction” correspond to PF1 (the fraction of outliers exceeding the threshold PA2) from the same requirement, with PA2 (the outlier threshold) set to 15 mmag by default. The “_ct” metrics simply capture the number of stars that went into the calculation.
metric name |
value |
units |
|---|---|---|
u_stellarPhotRepeatStdev |
10.082369 |
mmag |
u_stellarPhotRepeatOutlierFraction |
8.125000 |
% |
u_ct |
160.0 |
ct |
g_stellarPhotRepeatStdev |
11.278285 |
mmag |
g_stellarPhotRepeatOutlierFraction |
5.925926 |
% |
g_ct |
540.0 |
ct |
r_stellarPhotRepeatStdev |
9.653192 |
mmag |
r_stellarPhotRepeatOutlierFraction |
7.682292 |
% |
r_ct |
768.0 |
ct |
i_stellarPhotRepeatStdev |
6.544506 |
mmag |
i_stellarPhotRepeatOutlierFraction |
0.360144 |
% |
i_ct |
833.0 |
ct |
z_stellarPhotRepeatStdev |
7.944945 |
mmag |
z_stellarPhotRepeatOutlierFraction |
1.505646 |
% |
z_ct |
797.0 |
ct |
y_stellarPhotRepeatStdev |
8.168943 |
mmag |
y_stellarPhotRepeatOutlierFraction |
0.319489 |
% |
y_ct |
313.0 |
ct |
metricBundle: stellarPhotometricRepeatabilityCalib (source)
Docstring: Compute photometric repeatability from multiple measurements of a set of stars. First, a set of per-source quality criteria are applied. Second, the individual source measurements are grouped together by object index and per-group quantities are computed (e.g., a representative S/N for the group based on the median of associated per-source measurements). Third, additional per-group criteria are applied. Fourth, summary statistics are computed for the filtered groups.
metric name |
value |
units |
|---|---|---|
u_stellarPhotRepeatStdev |
7.905896 |
mmag |
u_stellarPhotRepeatOutlierFraction |
1.492537 |
% |
u_ct |
134.0 |
ct |
g_stellarPhotRepeatStdev |
9.951525 |
mmag |
g_stellarPhotRepeatOutlierFraction |
5.023923 |
% |
g_ct |
418.0 |
ct |
r_stellarPhotRepeatStdev |
11.208904 |
mmag |
r_stellarPhotRepeatOutlierFraction |
8.910891 |
% |
r_ct |
505.0 |
ct |
i_stellarPhotRepeatStdev |
3.709744 |
mmag |
i_stellarPhotRepeatOutlierFraction |
0.000000 |
% |
i_ct |
492.0 |
ct |
z_stellarPhotRepeatStdev |
3.154263 |
mmag |
z_stellarPhotRepeatOutlierFraction |
0.000000 |
% |
z_ct |
423.0 |
ct |
y_stellarPhotRepeatStdev |
6.970876 |
mmag |
y_stellarPhotRepeatOutlierFraction |
0.000000 |
% |
y_ct |
149.0 |
ct |
metricBundle: stellarPhotometricResiduals (source)
Docstring: Plot mean photometric residuals as a function of the position on the focal plane. First, a set of per-source quality criteria are applied. Second, the individual source measurements are grouped together by object index and the per-group magnitude is computed. The residuals between the individual sources and these magnitudes are then used to construct a plot showing the mean residual as a function of the focal-plane position.
Notes: In addition to producing plots of the residuals as a function of focal plane position, the median, standard deviation (“Stdev”), and the median absolute deviation \(\sigma_{MAD}\) (“SigmaMad”) are reported for the tract. Because these are residuals about the median, the median residual should be 0 by construction.
metric name |
value |
units |
|---|---|---|
u_photResidTractSigmaMad |
7.106819 |
mmag |
u_photResidTractStdev |
14.064299 |
mmag |
u_photResidTractMedian |
0.000000 |
mmag |
g_photResidTractSigmaMad |
8.182756 |
mmag |
g_photResidTractStdev |
10.718751 |
mmag |
g_photResidTractMedian |
0.000000 |
mmag |
r_photResidTractSigmaMad |
5.673041 |
mmag |
r_photResidTractStdev |
6.913324 |
mmag |
r_photResidTractMedian |
0.000000 |
mmag |
i_photResidTractSigmaMad |
5.870441 |
mmag |
i_photResidTractStdev |
6.884908 |
mmag |
i_photResidTractMedian |
0.000000 |
mmag |
z_photResidTractSigmaMad |
5.960165 |
mmag |
z_photResidTractStdev |
8.674804 |
mmag |
z_photResidTractMedian |
0.000000 |
mmag |
y_photResidTractSigmaMad |
7.328806 |
mmag |
y_photResidTractStdev |
8.854357 |
mmag |
y_photResidTractMedian |
0.000000 |
mmag |
metricBundle: stellarPhotometricResidualsCalib (source)
Docstring: Plot mean photometric residuals as a function of the position on the focal plane. First, a set of per-source quality criteria are applied. Second, the individual source measurements are grouped together by object index and the per-group magnitude is computed. The residuals between the individual sources and these magnitudes are then used to construct a plot showing the mean residual as a function of the focal-plane position.
metric name |
value |
units |
|---|---|---|
u_photResidTractSigmaMad |
6.159587 |
mmag |
u_photResidTractStdev |
10.387054 |
mmag |
u_photResidTractMedian |
0.000000 |
mmag |
g_photResidTractSigmaMad |
7.016645 |
mmag |
g_photResidTractStdev |
9.551593 |
mmag |
g_photResidTractMedian |
0.000000 |
mmag |
r_photResidTractSigmaMad |
4.761156 |
mmag |
r_photResidTractStdev |
6.989406 |
mmag |
r_photResidTractMedian |
0.000000 |
mmag |
i_photResidTractSigmaMad |
5.027914 |
mmag |
i_photResidTractStdev |
7.205964 |
mmag |
i_photResidTractMedian |
0.000000 |
mmag |
z_photResidTractSigmaMad |
4.924935 |
mmag |
z_photResidTractStdev |
7.766163 |
mmag |
z_photResidTractMedian |
0.000000 |
mmag |
y_photResidTractSigmaMad |
7.862110 |
mmag |
y_photResidTractStdev |
9.141854 |
mmag |
y_photResidTractMedian |
0.000000 |
mmag |
sourceObjectTable_metrics#
dataId used in examples:
did_visit_det = {'visit': 2024120500075, 'skymap': 'lsst_cells_v1', 'instrument': 'LSSTComCam', 'detector': 4}
metricBundle: astromColorDiffMetrics (source)
Docstring: Calculate the AB1 and ABF1 metrics from the difference between the target and reference catalog coordinates.
metric name |
value |
units |
|---|---|---|
AB1_RA |
13.946738 |
mas |
ABF1_RA |
14.849624 |
% |
AB1_Dec |
8.169414 |
mas |
ABF1_Dec |
2.067669 |
% |
AB1_tot |
16.971670 |
mas |
ABF1_tot |
24.812030 |
% |
preSourceTableCore_metrics#
dataId used in examples:
did_visit_det = {'visit': 2024120500075, 'skymap': 'lsst_cells_v1', 'instrument': 'LSSTComCam', 'detector': 4}
metricBundle: skyFluxVisitStatisticMetric source
Docstring: Calculate sky flux statistics. This uses the 9-pixel aperture flux for sky sources/objects, and returns multiple statistics on the measured fluxes. Note that either visitContext (measurement on sourceTable) or coaddContext (measurement on objectTable) must be specified.
metric name |
value |
units |
|---|---|---|
medianSky |
-2.348488 |
nJy |
meanSky |
-7.034565 |
nJy |
stdevSky |
618.708919 |
nJy |
sigmaMADSky |
600.762855 |
nJy |
Note that the default visit (7024040300001) used for this document did not have an entry for preSourceTableCore_metrics, so these values are for visit 7024040300002.
Tract-level metrics#
diaSourceTableTract_metrics#
dataId used in examples:
did_tract = {'tract': 5063, 'skymap': 'lsst_cells_v1', 'band': 'g', 'instrument': 'LSSTComCam'}
metricBundle: NumDiaSources (source)
Docstring: Count all DiaSources that do not have known bad/quality flags.
metric name |
value |
units |
|---|---|---|
numDiaSources |
96643.0 |
ct |
metricBundle: NumStreakCenterDiaSources (source)
Docstring: Count DiaSources that have the STREAK flag in the center of the source.
metric name |
value |
units |
|---|---|---|
numStreakCenterDiaSources |
115.0 |
ct |
metricBundle: NumStreakDiaSources (source)
Docstring: Count DiaSources that fall in a STREAK flag footprint region.
metric name |
value |
units |
|---|---|---|
numStreakDiaSources |
116.0 |
ct |
objectTableColumnValidate_metrics#
dataId used in examples:
did_tract = {'tract': 5063, 'skymap': 'lsst_cells_v1', 'band': 'g', 'instrument': 'LSSTComCam'}
metricBundle: validCmodelFluxMetric (source)
Docstring: Calculate the fraction of values in a column that have valid numerical values (i.e., not NaN), and that fall within the specified “reasonable” range for the values.
metric name |
value |
units |
|---|---|---|
u_validFracColumn |
44.901217 |
% |
u_nanFracColumn |
42.851855 |
% |
g_validFracColumn |
90.825567 |
% |
g_nanFracColumn |
5.225247 |
% |
r_validFracColumn |
89.916261 |
% |
r_nanFracColumn |
6.306434 |
% |
i_validFracColumn |
89.704590 |
% |
i_nanFracColumn |
5.970174 |
% |
z_validFracColumn |
86.220004 |
% |
z_nanFracColumn |
6.772176 |
% |
y_validFracColumn |
67.222752 |
% |
y_nanFracColumn |
15.830500 |
% |
metricBundle: validPsfFluxMetric (source)
Docstring: Calculate the fraction of values in a column that have valid numerical values (i.e., not NaN), and that fall within the specified “reasonable” range for the values.
metric name |
value |
units |
|---|---|---|
u_validFracColumn |
46.466084 |
% |
u_nanFracColumn |
40.227490 |
% |
g_validFracColumn |
93.893007 |
% |
g_nanFracColumn |
1.868023 |
% |
r_validFracColumn |
92.928092 |
% |
r_nanFracColumn |
2.955407 |
% |
i_validFracColumn |
92.475233 |
% |
i_nanFracColumn |
2.573486 |
% |
z_validFracColumn |
88.955097 |
% |
z_nanFracColumn |
3.368476 |
% |
y_validFracColumn |
69.016903 |
% |
y_nanFracColumn |
12.810026 |
% |
objectTableCore_metrics#
dataId used in examples:
did_tract = {'tract': 5063, 'skymap': 'lsst_cells_v1', 'band': 'g', 'instrument': 'LSSTComCam'}
metricBundle: blendMetrics (source)
Docstring: Calculate metrics based on the performance of the deblender for blends with multiple children
metric name |
value |
units |
|---|---|---|
numBlends |
46065.000000 |
|
meanBlendIterations |
16.823771 |
|
meanBlendLogL |
-1053145.375000 |
metricBundle: coaddInputCount (source)
Docstring: skyPlot and associated metrics indicating the number of exposures that have gone into creating a coadd.
metric name |
value |
units |
|---|---|---|
u_inputCount_median |
5.0 |
ct |
u_inputCount_sigmaMad |
4.4 |
ct |
u_inputCount_mean |
5.9 |
ct |
g_inputCount_median |
109.0 |
ct |
g_inputCount_sigmaMad |
89.0 |
ct |
g_inputCount_mean |
102.1 |
ct |
r_inputCount_median |
130.0 |
ct |
r_inputCount_sigmaMad |
100.8 |
ct |
r_inputCount_mean |
120.0 |
ct |
i_inputCount_median |
85.0 |
ct |
i_inputCount_sigmaMad |
72.6 |
ct |
i_inputCount_mean |
83.2 |
ct |
z_inputCount_median |
95.0 |
ct |
z_inputCount_sigmaMad |
69.7 |
ct |
z_inputCount_mean |
88.0 |
ct |
y_inputCount_median |
17.0 |
ct |
y_inputCount_sigmaMad |
10.4 |
ct |
y_inputCount_mean |
15.6 |
ct |
metricBundle: coaddPatchCount (source)
Docstring: An atool to count the patches in a tract. Counts the patches that make it into the objectTable_tract.
metric name |
value |
units |
|---|---|---|
u_patchCount |
30.000000 |
|
g_patchCount |
47.000000 |
|
r_patchCount |
46.000000 |
|
i_patchCount |
47.000000 |
|
z_patchCount |
45.000000 |
|
y_patchCount |
40.000000 |
metricBundle: e1Diff (source)
Docstring: The difference between E1 and E1 PSF plotted on a scatter plot. Used in coaddQualityCore.
Notes: Statistics of residual of e1 ellipticity measurement of sources relative to the PSF.
metric name |
value |
units |
|---|---|---|
u_highSNStars_median |
-0.006962 |
pix |
u_highSNStars_sigmaMad |
0.012748 |
pix |
u_highSNStars_count |
7.0 |
ct |
u_lowSNStars_median |
0.000510 |
pix |
u_lowSNStars_sigmaMad |
0.006357 |
pix |
u_lowSNStars_count |
137.0 |
ct |
g_highSNStars_median |
0.001289 |
pix |
g_highSNStars_sigmaMad |
0.003274 |
pix |
g_highSNStars_count |
458.0 |
ct |
g_lowSNStars_median |
0.000393 |
pix |
g_lowSNStars_sigmaMad |
0.004051 |
pix |
g_lowSNStars_count |
1522.0 |
ct |
r_highSNStars_median |
0.000526 |
pix |
r_highSNStars_sigmaMad |
0.001800 |
pix |
r_highSNStars_count |
638.0 |
ct |
r_lowSNStars_median |
0.000351 |
pix |
r_lowSNStars_sigmaMad |
0.002744 |
pix |
r_lowSNStars_count |
1954.0 |
ct |
i_highSNStars_median |
0.000453 |
pix |
i_highSNStars_sigmaMad |
0.001744 |
pix |
i_highSNStars_count |
680.0 |
ct |
i_lowSNStars_median |
0.000210 |
pix |
i_lowSNStars_sigmaMad |
0.002965 |
pix |
i_lowSNStars_count |
2218.0 |
ct |
z_highSNStars_median |
-0.000107 |
pix |
z_highSNStars_sigmaMad |
0.002300 |
pix |
z_highSNStars_count |
610.0 |
ct |
z_lowSNStars_median |
-0.000013 |
pix |
z_lowSNStars_sigmaMad |
0.003097 |
pix |
z_lowSNStars_count |
1917.0 |
ct |
y_highSNStars_median |
0.000569 |
pix |
y_highSNStars_sigmaMad |
0.002821 |
pix |
y_highSNStars_count |
102.0 |
ct |
y_lowSNStars_median |
0.000041 |
pix |
y_lowSNStars_sigmaMad |
0.003921 |
pix |
y_lowSNStars_count |
772.0 |
ct |
metricBundle: e2Diff (source)
Docstring: The difference between E2 and E2 PSF plotted on a scatter plot for coadd level data. Used in coaddQualityCore.
Notes: Statistics of residual of e2 ellipticity measurement of sources relative to the PSF.
metric name |
value |
units |
|---|---|---|
u_highSNStars_median |
-0.007902 |
pix |
u_highSNStars_sigmaMad |
0.011632 |
pix |
u_highSNStars_count |
7.0 |
ct |
u_lowSNStars_median |
0.000784 |
pix |
u_lowSNStars_sigmaMad |
0.005373 |
pix |
u_lowSNStars_count |
137.0 |
ct |
g_highSNStars_median |
0.000637 |
pix |
g_highSNStars_sigmaMad |
0.002228 |
pix |
g_highSNStars_count |
458.0 |
ct |
g_lowSNStars_median |
0.000124 |
pix |
g_lowSNStars_sigmaMad |
0.003238 |
pix |
g_lowSNStars_count |
1522.0 |
ct |
r_highSNStars_median |
0.000508 |
pix |
r_highSNStars_sigmaMad |
0.001917 |
pix |
r_highSNStars_count |
638.0 |
ct |
r_lowSNStars_median |
0.000388 |
pix |
r_lowSNStars_sigmaMad |
0.002888 |
pix |
r_lowSNStars_count |
1954.0 |
ct |
i_highSNStars_median |
0.000883 |
pix |
i_highSNStars_sigmaMad |
0.002213 |
pix |
i_highSNStars_count |
680.0 |
ct |
i_lowSNStars_median |
0.000855 |
pix |
i_lowSNStars_sigmaMad |
0.003093 |
pix |
i_lowSNStars_count |
2218.0 |
ct |
z_highSNStars_median |
-0.000148 |
pix |
z_highSNStars_sigmaMad |
0.001759 |
pix |
z_highSNStars_count |
610.0 |
ct |
z_lowSNStars_median |
-0.000071 |
pix |
z_lowSNStars_sigmaMad |
0.002598 |
pix |
z_lowSNStars_count |
1917.0 |
ct |
y_highSNStars_median |
-0.000236 |
pix |
y_highSNStars_sigmaMad |
0.002834 |
pix |
y_highSNStars_count |
102.0 |
ct |
y_lowSNStars_median |
-0.000439 |
pix |
y_lowSNStars_sigmaMad |
0.003815 |
pix |
y_lowSNStars_count |
772.0 |
ct |
metricBundle: isolatedDeblenderMetrics (source)
Docstring: Calculate metrics based on the performance of the deblender for parents with only a single child peak.
metric name |
value |
units |
|---|---|---|
numIsolated |
67992.000000 |
|
meanIsolatedIterations |
16.082113 |
|
meanIsolatedLogL |
-677.472961 |
metricBundle: parentDeblenderMetrics (source)
Docstring: Calculate metrics based on the performance of the deblender
metric name |
value |
units |
|---|---|---|
numParents |
114061.000000 |
|
numDeblendFailed |
0.000000 |
|
numIncompleteData |
45524.000000 |
|
numDetectedPeaks |
363411.000000 |
|
numDeblendedChildren |
359466.000000 |
metricBundle: psfCModelScatter (source)
Docstring: Creates a scatterPlot showing the difference between PSF and CModel mags
Notes: Metrics give summary statistics of the PSF-cmodel magnitudes.
metric name |
value |
units |
|---|---|---|
u_psf_cModel_diff_median |
1.062645 |
mmag |
u_psf_cModel_diff_sigmaMad |
4.325282 |
mmag |
u_psf_cModel_diff_mean |
10.745125 |
mmag |
g_psf_cModel_diff_median |
-2.305251 |
mmag |
g_psf_cModel_diff_sigmaMad |
2.320611 |
mmag |
g_psf_cModel_diff_mean |
-1.821309 |
mmag |
r_psf_cModel_diff_median |
-1.147710 |
mmag |
r_psf_cModel_diff_sigmaMad |
2.572899 |
mmag |
r_psf_cModel_diff_mean |
-0.521258 |
mmag |
i_psf_cModel_diff_median |
-0.576176 |
mmag |
i_psf_cModel_diff_sigmaMad |
2.773069 |
mmag |
i_psf_cModel_diff_mean |
-0.551983 |
mmag |
z_psf_cModel_diff_median |
-1.466141 |
mmag |
z_psf_cModel_diff_sigmaMad |
2.297925 |
mmag |
z_psf_cModel_diff_mean |
-1.435888 |
mmag |
y_psf_cModel_diff_median |
-2.427449 |
mmag |
y_psf_cModel_diff_sigmaMad |
2.106005 |
mmag |
y_psf_cModel_diff_mean |
-1.936034 |
mmag |
metricBundle: shapeSizeFractionalDiff (source)
Docstring: The difference between shape and shape PSF plotted on a scatter plot for coadd level data. Used in coaddQualityCore.
Notes: Fractional size residuals (\(S/S_{PSF} - 1\)). Stars with “highSN” have S/N > 2700, and “lowSN” have S/N > 500.
metric name |
value |
units |
|---|---|---|
u_highSNStars_median |
-0.018624 |
pix |
u_highSNStars_sigmaMad |
0.028057 |
pix |
u_highSNStars_count |
7.0 |
ct |
u_lowSNStars_median |
-0.001748 |
pix |
u_lowSNStars_sigmaMad |
0.006542 |
pix |
u_lowSNStars_count |
137.0 |
ct |
g_highSNStars_median |
0.000799 |
pix |
g_highSNStars_sigmaMad |
0.005744 |
pix |
g_highSNStars_count |
458.0 |
ct |
g_lowSNStars_median |
0.000275 |
pix |
g_lowSNStars_sigmaMad |
0.006641 |
pix |
g_lowSNStars_count |
1522.0 |
ct |
r_highSNStars_median |
-0.000390 |
pix |
r_highSNStars_sigmaMad |
0.003146 |
pix |
r_highSNStars_count |
638.0 |
ct |
r_lowSNStars_median |
0.000291 |
pix |
r_lowSNStars_sigmaMad |
0.003772 |
pix |
r_lowSNStars_count |
1954.0 |
ct |
i_highSNStars_median |
-0.001118 |
pix |
i_highSNStars_sigmaMad |
0.003354 |
pix |
i_highSNStars_count |
680.0 |
ct |
i_lowSNStars_median |
-0.000326 |
pix |
i_lowSNStars_sigmaMad |
0.003610 |
pix |
i_lowSNStars_count |
2218.0 |
ct |
z_highSNStars_median |
-0.000394 |
pix |
z_highSNStars_sigmaMad |
0.003151 |
pix |
z_highSNStars_count |
610.0 |
ct |
z_lowSNStars_median |
0.000573 |
pix |
z_lowSNStars_sigmaMad |
0.003387 |
pix |
z_lowSNStars_count |
1917.0 |
ct |
y_highSNStars_median |
-0.004150 |
pix |
y_highSNStars_sigmaMad |
0.004891 |
pix |
y_highSNStars_count |
102.0 |
ct |
y_lowSNStars_median |
-0.000406 |
pix |
y_lowSNStars_sigmaMad |
0.003624 |
pix |
y_lowSNStars_count |
772.0 |
ct |
metricBundle: skippedDeblenderMetrics (source)
Docstring: Calculate metrics based on blends skipped by the deblender
metric name |
value |
units |
|---|---|---|
numSkippedBlends |
4.000000 |
|
numBlendParentTooBig |
4.000000 |
|
numBlendTooManyPeaks |
0.000000 |
|
numBlendTooManyMasked |
0.000000 |
|
numSkippedPeaks |
3945.000000 |
metricBundle: skyFluxStatisticMetric (source)
Docstring: Calculate sky flux statistics. This uses the 9-pixel aperture flux for sky sources/objects, and returns multiple statistics on the measured fluxes. Note that either visitContext (measurement on sourceTable) or coaddContext (measurement on objectTable) must be specified.
metric name |
value |
units |
|---|---|---|
u_medianSky |
-22.670816 |
nJy |
u_meanSky |
-44.955825 |
nJy |
u_stdevSky |
458.312329 |
nJy |
u_sigmaMADSky |
358.909370 |
nJy |
g_medianSky |
2.320502 |
nJy |
g_meanSky |
5.908797 |
nJy |
g_stdevSky |
122.467253 |
nJy |
g_sigmaMADSky |
65.140802 |
nJy |
r_medianSky |
-0.373212 |
nJy |
r_meanSky |
2.401479 |
nJy |
r_stdevSky |
217.256946 |
nJy |
r_sigmaMADSky |
89.284979 |
nJy |
i_medianSky |
-9.153765 |
nJy |
i_meanSky |
-8.731332 |
nJy |
i_stdevSky |
225.413986 |
nJy |
i_sigmaMADSky |
132.290373 |
nJy |
z_medianSky |
-38.847815 |
nJy |
z_meanSky |
-37.734689 |
nJy |
z_stdevSky |
468.570872 |
nJy |
z_sigmaMADSky |
234.272551 |
nJy |
y_medianSky |
-178.689968 |
nJy |
y_meanSky |
-230.084323 |
nJy |
y_stdevSky |
1662.990931 |
nJy |
y_sigmaMADSky |
1127.054293 |
nJy |
metricBundle: wPerpCModel (source)
Docstring: No docstring
Notes: Width of stellar locus in (r-i) vs. (g-r) as defined in Ivezic et al. 2004, measured with cmodel magnitudes.
metric name |
value |
units |
|---|---|---|
wPerp_cModelFlux_sigmaMAD |
14.941928 |
mmag |
wPerp_cModelFlux_median |
0.408690 |
mmag |
metricBundle: wPerpPSFP (source)
Docstring: No docstring
Notes: Width of the blue portion of the stellar locus in (r-i) vs. (g-r) as defined in Ivezic et al. 2004, measured with PSF magnitudes.
metric name |
value |
units |
|---|---|---|
wPerp_psfFlux_sigmaMAD |
14.965038 |
mmag |
wPerp_psfFlux_median |
0.354766 |
mmag |
metricBundle: xPerpCModel (source)
Docstring: No docstring
Notes: Width of the red portion of the stellar locus in (r-i) vs. (g-r) as defined in Ivezic et al. 2004, measured with cmodel magnitudes.
metric name |
value |
units |
|---|---|---|
xPerp_cModelFlux_sigmaMAD |
56.216178 |
mmag |
xPerp_cModelFlux_median |
1.497274 |
mmag |
metricBundle: xPerpPSFP (source)
Docstring: No docstring
Notes: Width of the red portion of the stellar locus in (r-i) vs. (g-r) as defined in Ivezic et al. 2004, measured with PSF magnitudes.
metric name |
value |
units |
|---|---|---|
xPerp_psfFlux_sigmaMAD |
55.733773 |
mmag |
xPerp_psfFlux_median |
0.950084 |
mmag |
metricBundle: yPerpCModel (source)
Docstring: No docstring
metric name |
value |
units |
|---|---|---|
yPerp_cModelFlux_sigmaMAD |
9.130749 |
mmag |
yPerp_cModelFlux_median |
-0.721818 |
mmag |
metricBundle: yPerpPSF (source)
Docstring: No docstring
metric name |
value |
units |
|---|---|---|
yPerp_psfFlux_sigmaMAD |
8.156364 |
mmag |
yPerp_psfFlux_median |
-0.542668 |
mmag |
Note the erroneous “P” at the end of “wPerpPSFP” and “xPerpPSFP”. This is due to a typo in the pipelines code.
objectTableExtended_metrics#
dataId used in examples:
did_tract = {'tract': 5063, 'skymap': 'lsst_cells_v1', 'band': 'g', 'instrument': 'LSSTComCam'}
metricBundle: ap12PsfSky (source)
Docstring: No docstring
Notes: Difference between magnitudes in a 12-pixel aperture and PSF magnitudes. Metrics summarize rolled-up statistics of the plotted quantities.
metric name |
value |
units |
|---|---|---|
g_ap12_psf_diff_median |
-2.497167 |
mmag |
g_ap12_psf_diff_sigmaMad |
7.382115 |
mmag |
g_ap12_psf_diff_mean |
-3.173155 |
mmag |
r_ap12_psf_diff_median |
-1.285786 |
mmag |
r_ap12_psf_diff_sigmaMad |
4.182110 |
mmag |
r_ap12_psf_diff_mean |
-3.415648 |
mmag |
i_ap12_psf_diff_median |
-1.689628 |
mmag |
i_ap12_psf_diff_sigmaMad |
4.563705 |
mmag |
i_ap12_psf_diff_mean |
-3.558899 |
mmag |
Visit-level plots#
matchedVisitCore#
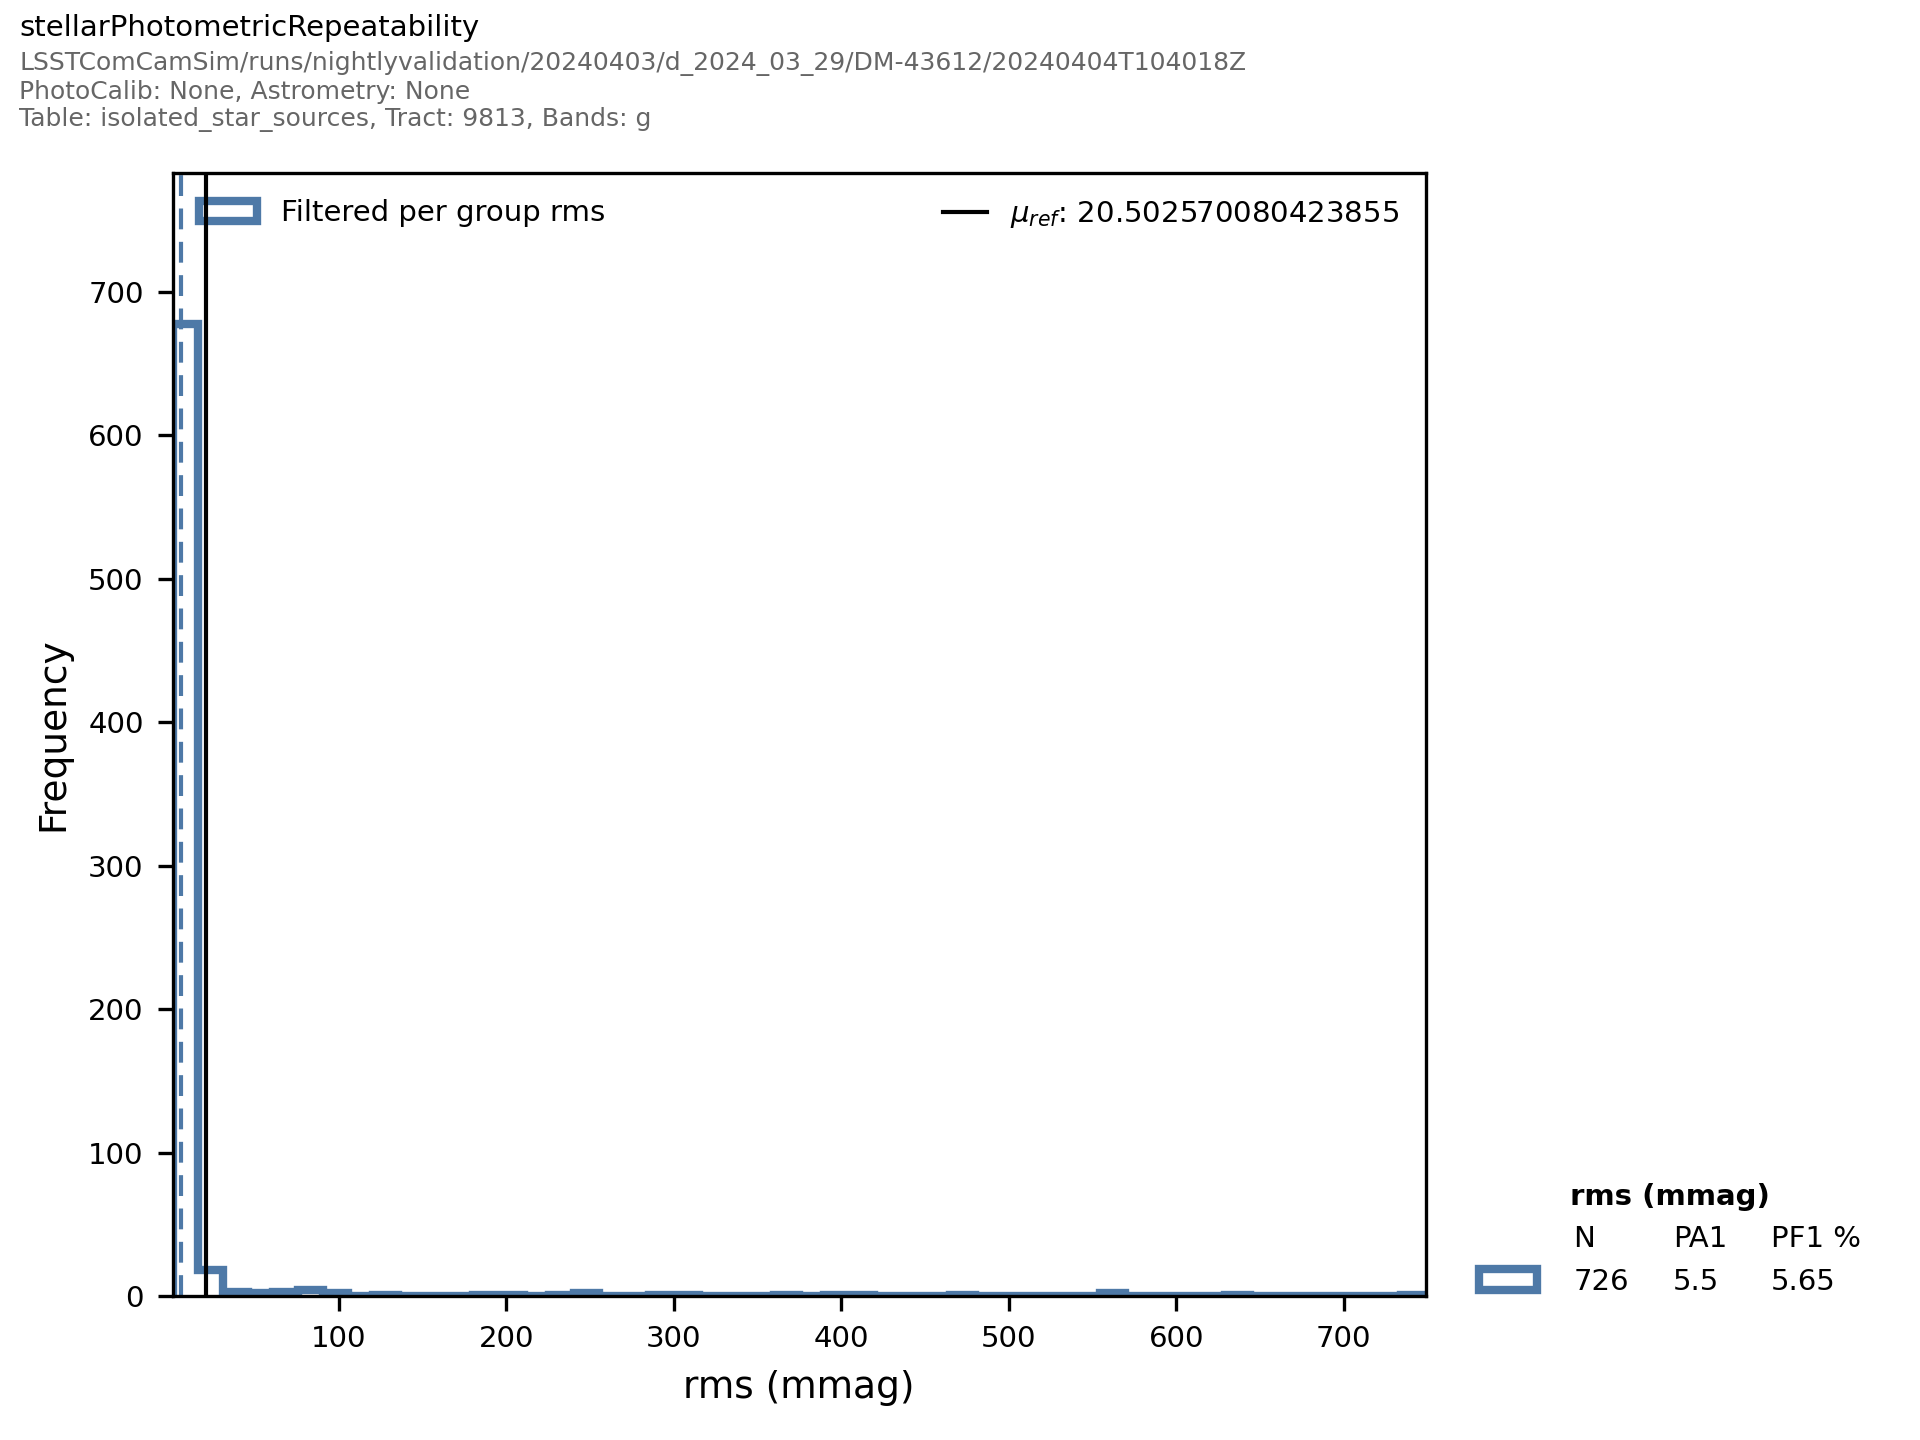
Fig. 1 Plot Name: matchedVisitCore_g_stellarPhotometricRepeatability_HistPlot#
Associated metrics: matchedVisitCore_metrics
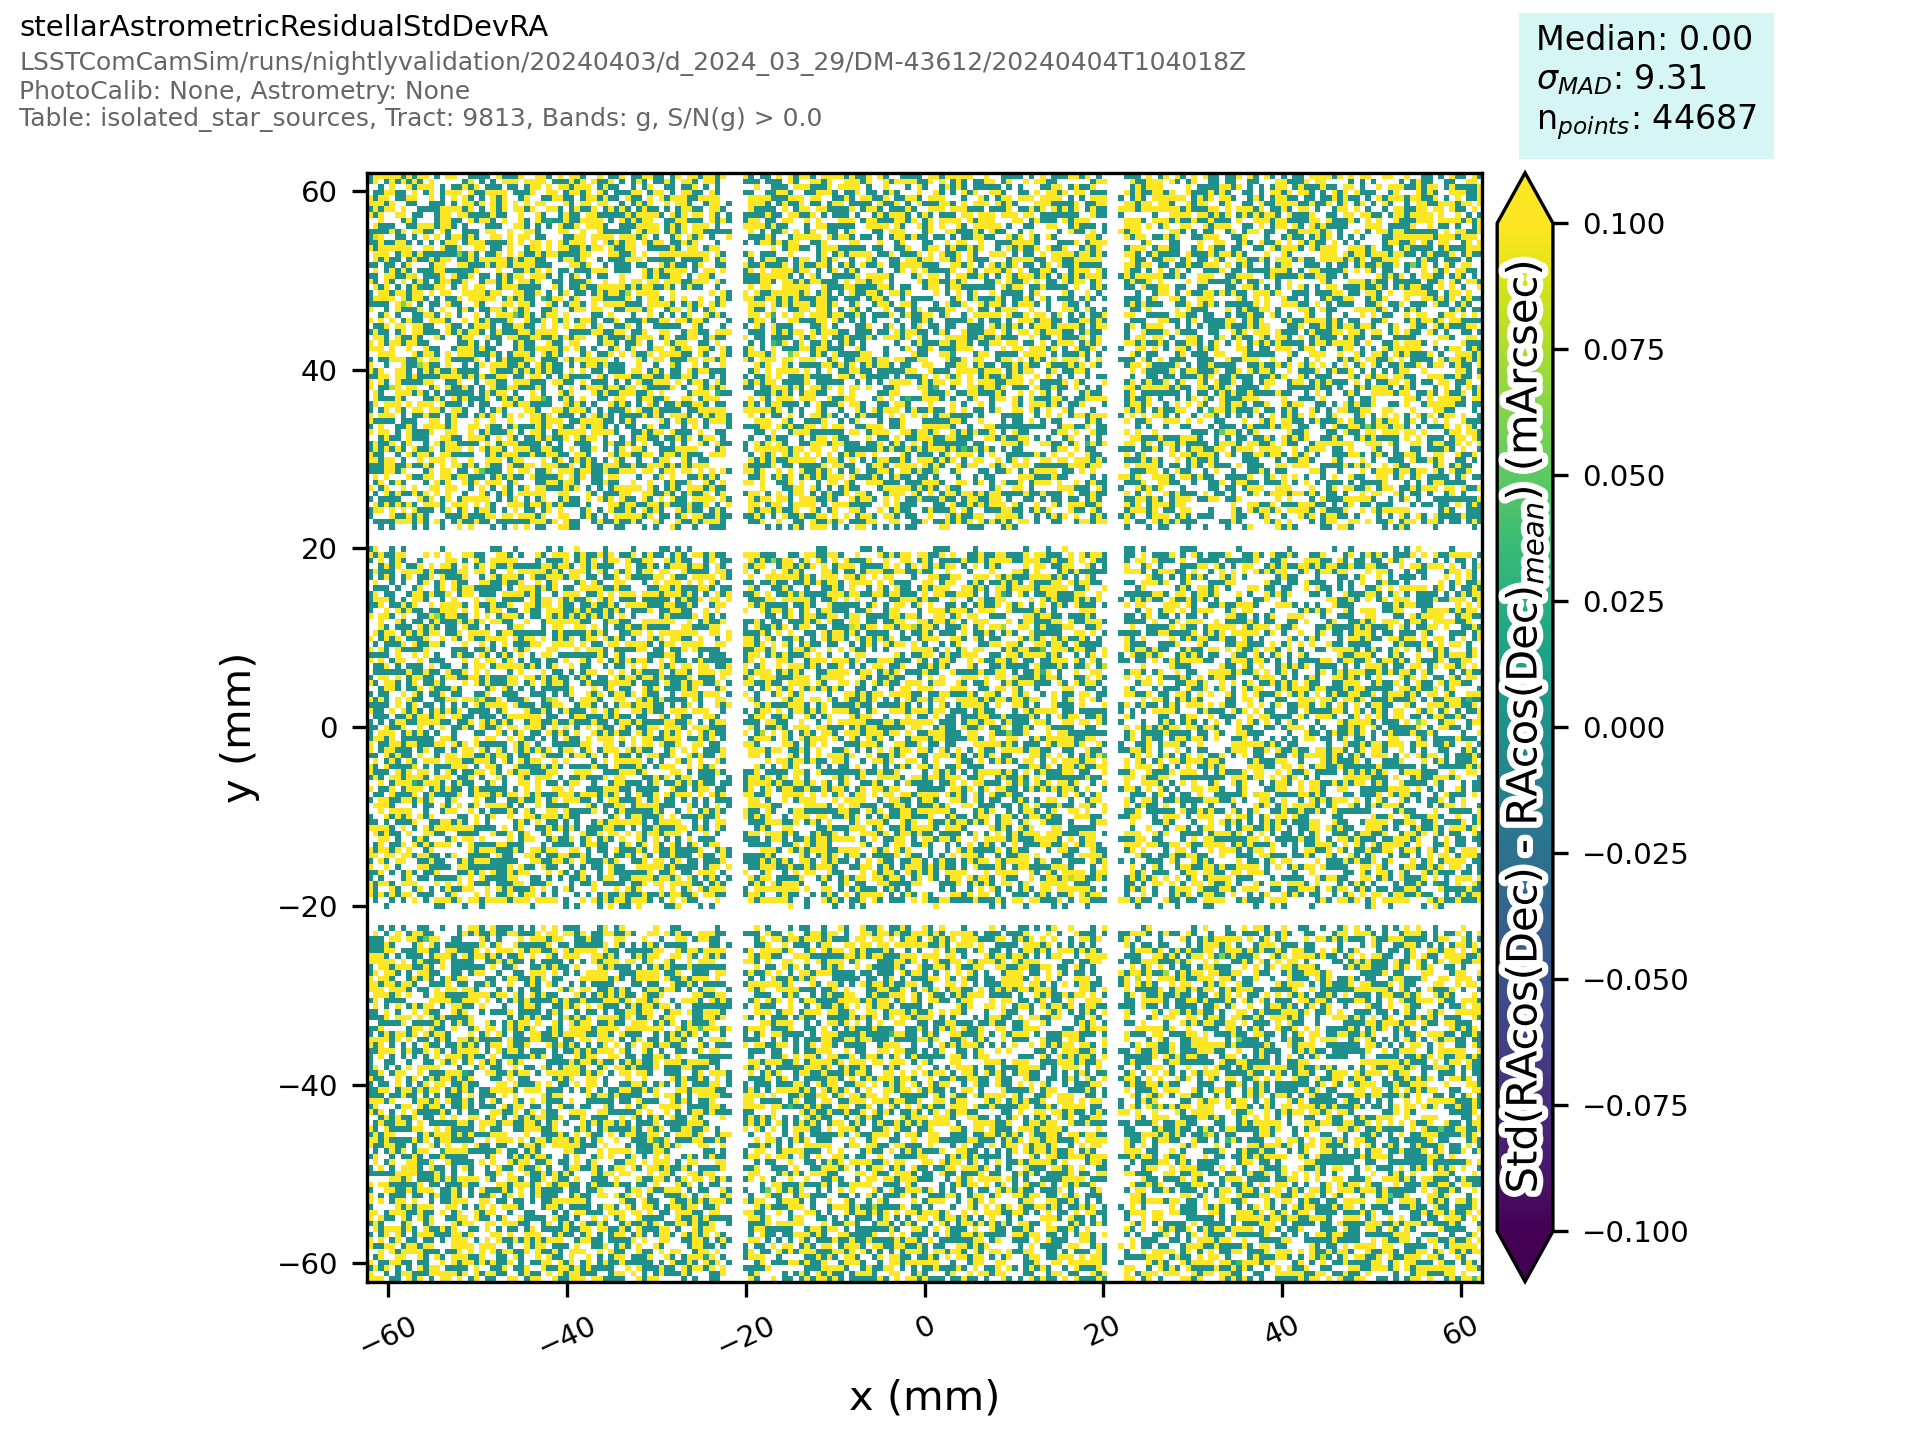
Fig. 2 Plot Name: matchedVisitCore_g_stellarAstrometricResidualStdDevRA_FocalPlanePlot#
Associated metrics: matchedVisitCore_metrics
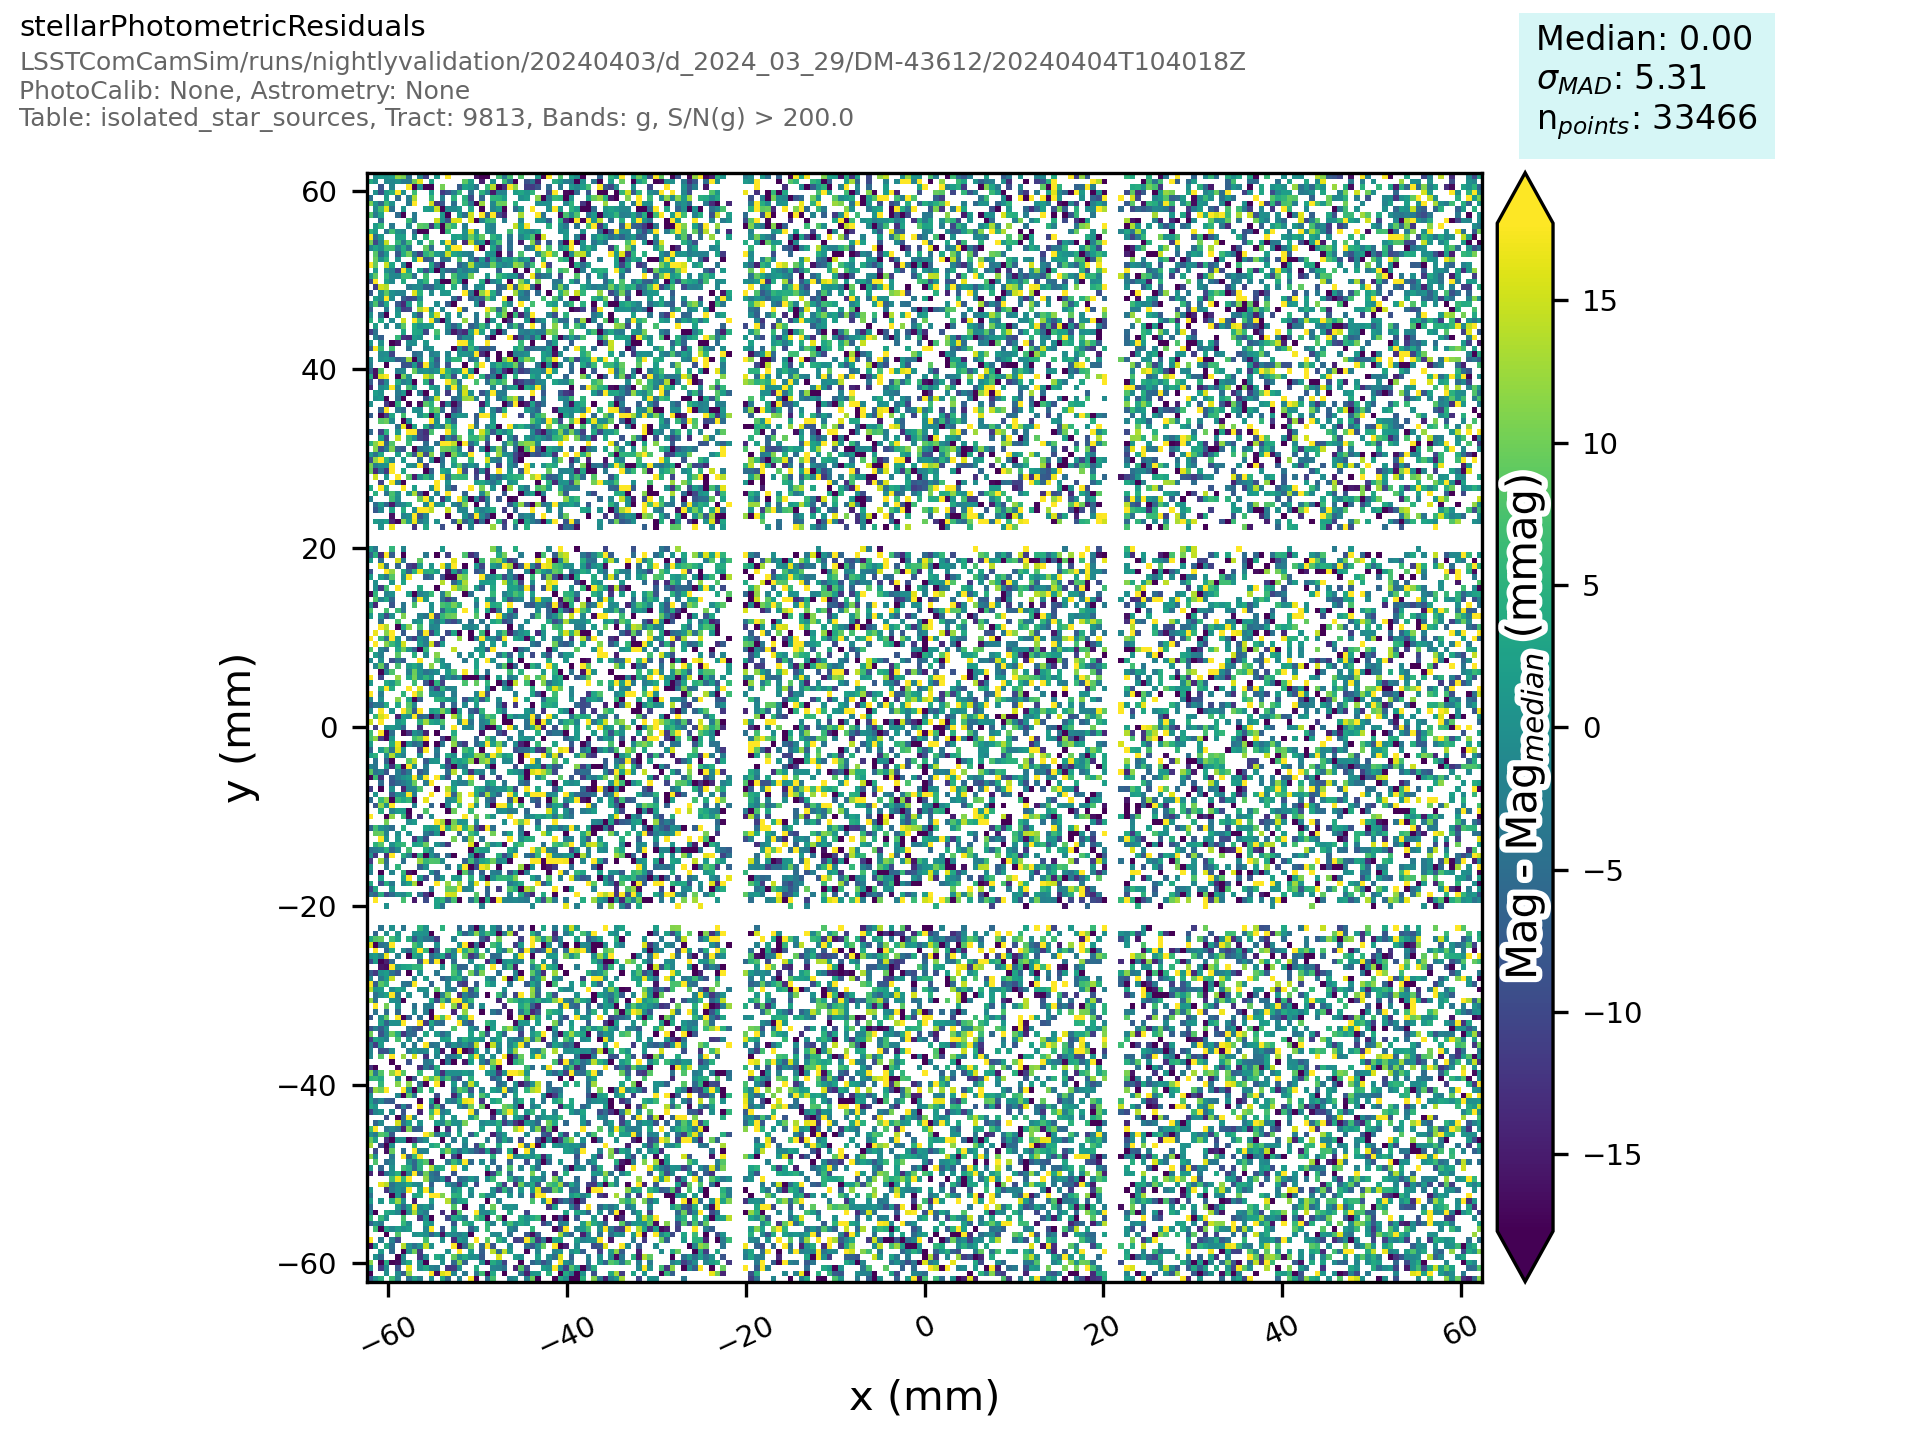
Fig. 3 Plot Name: matchedVisitCore_g_stellarPhotometricResiduals_FocalPlanePlot#
Associated metrics: matchedVisitCore_metrics
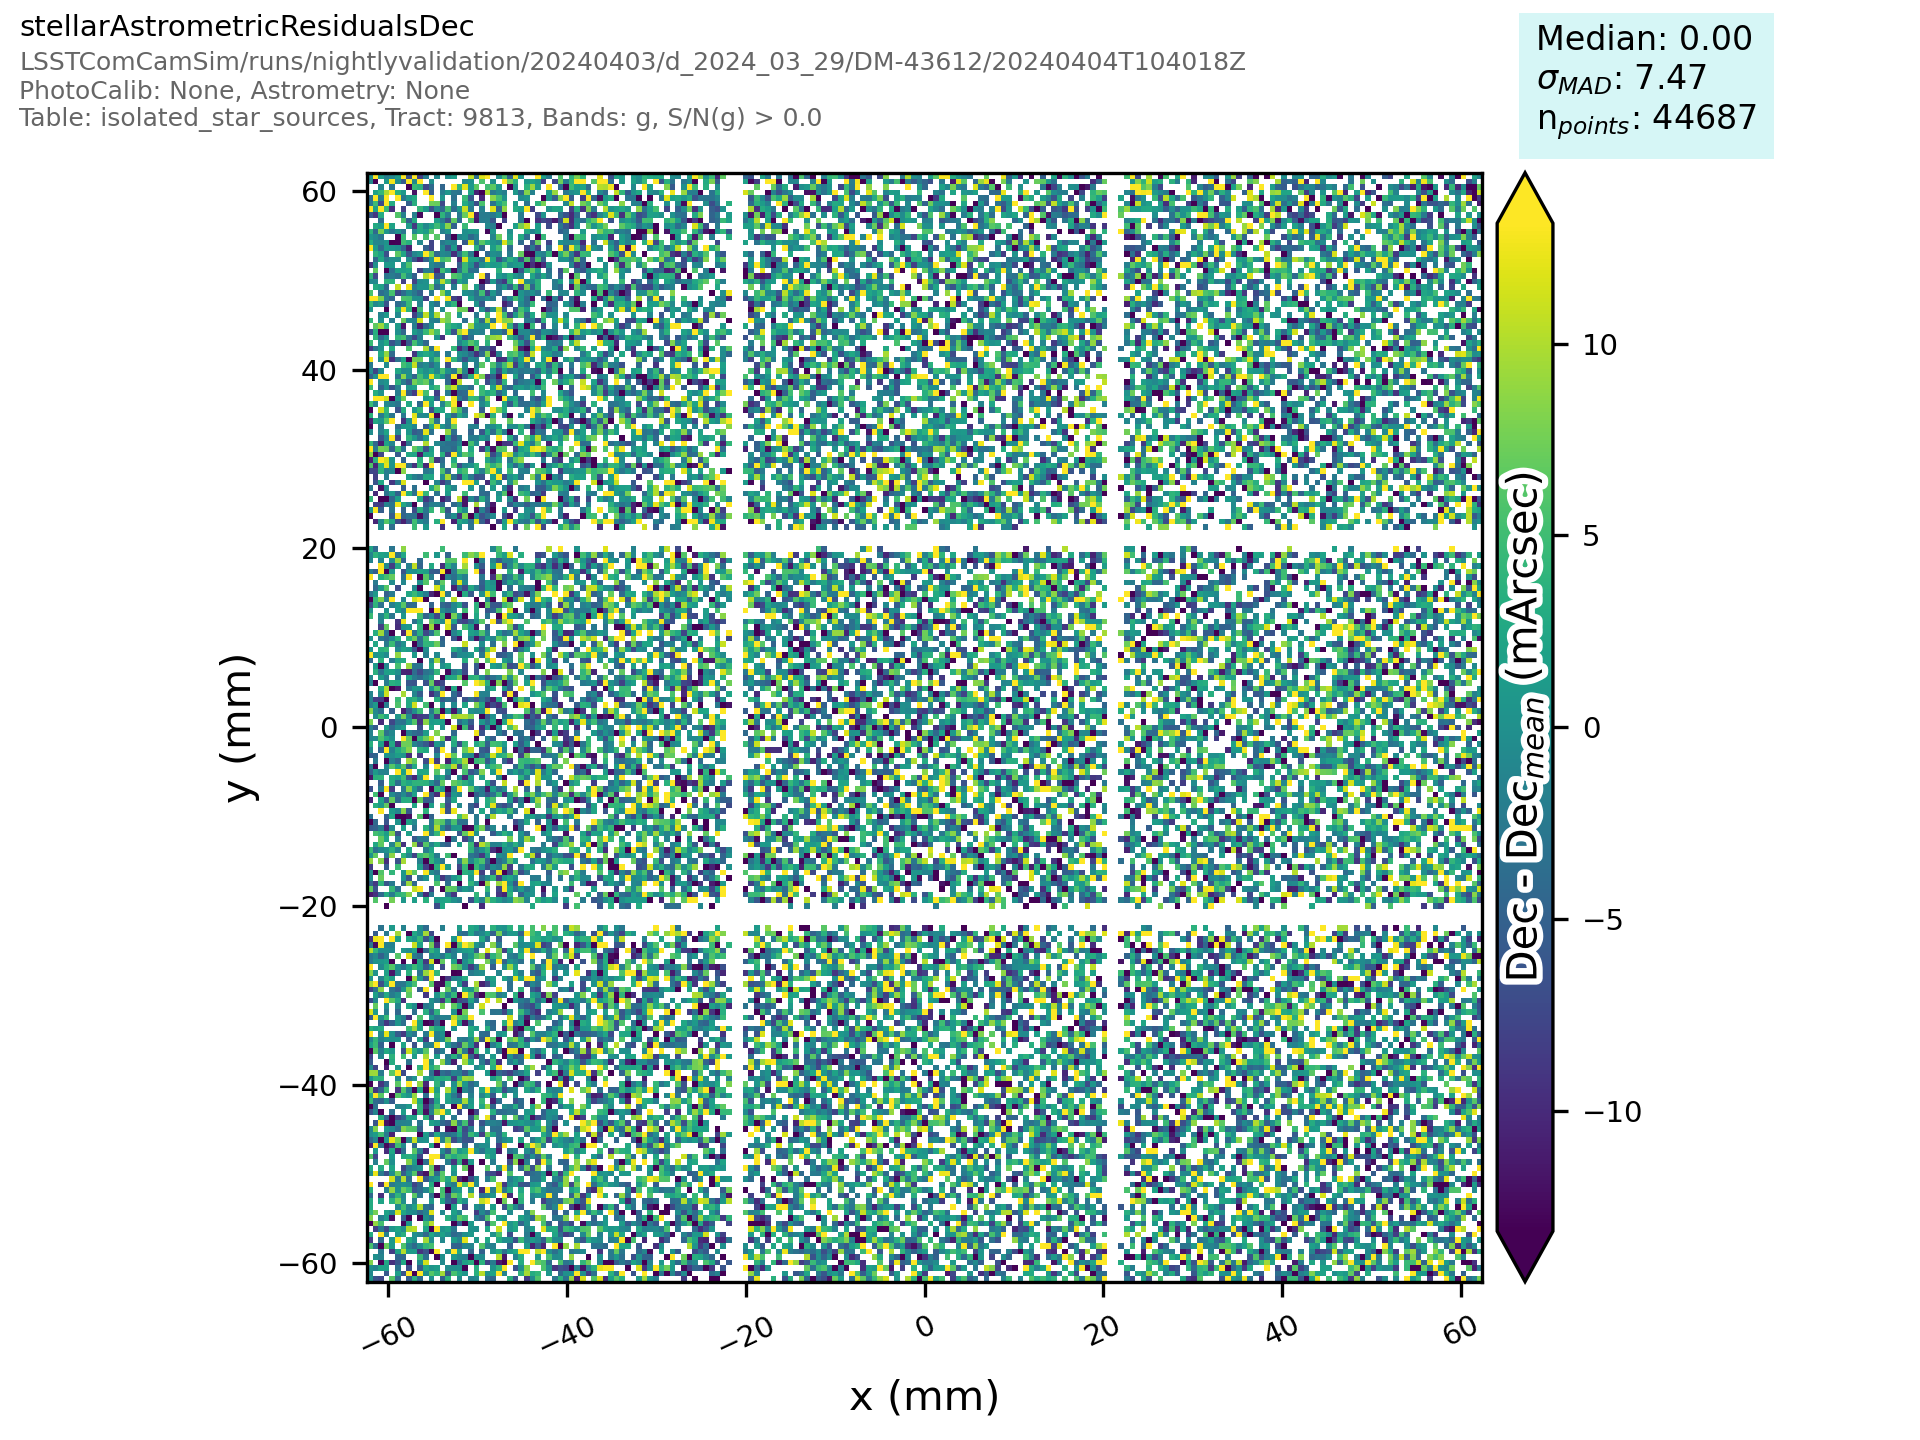
Fig. 4 Plot Name: matchedVisitCore_g_stellarAstrometricResidualsDec_FocalPlanePlot#
Associated metrics: matchedVisitCore_metrics
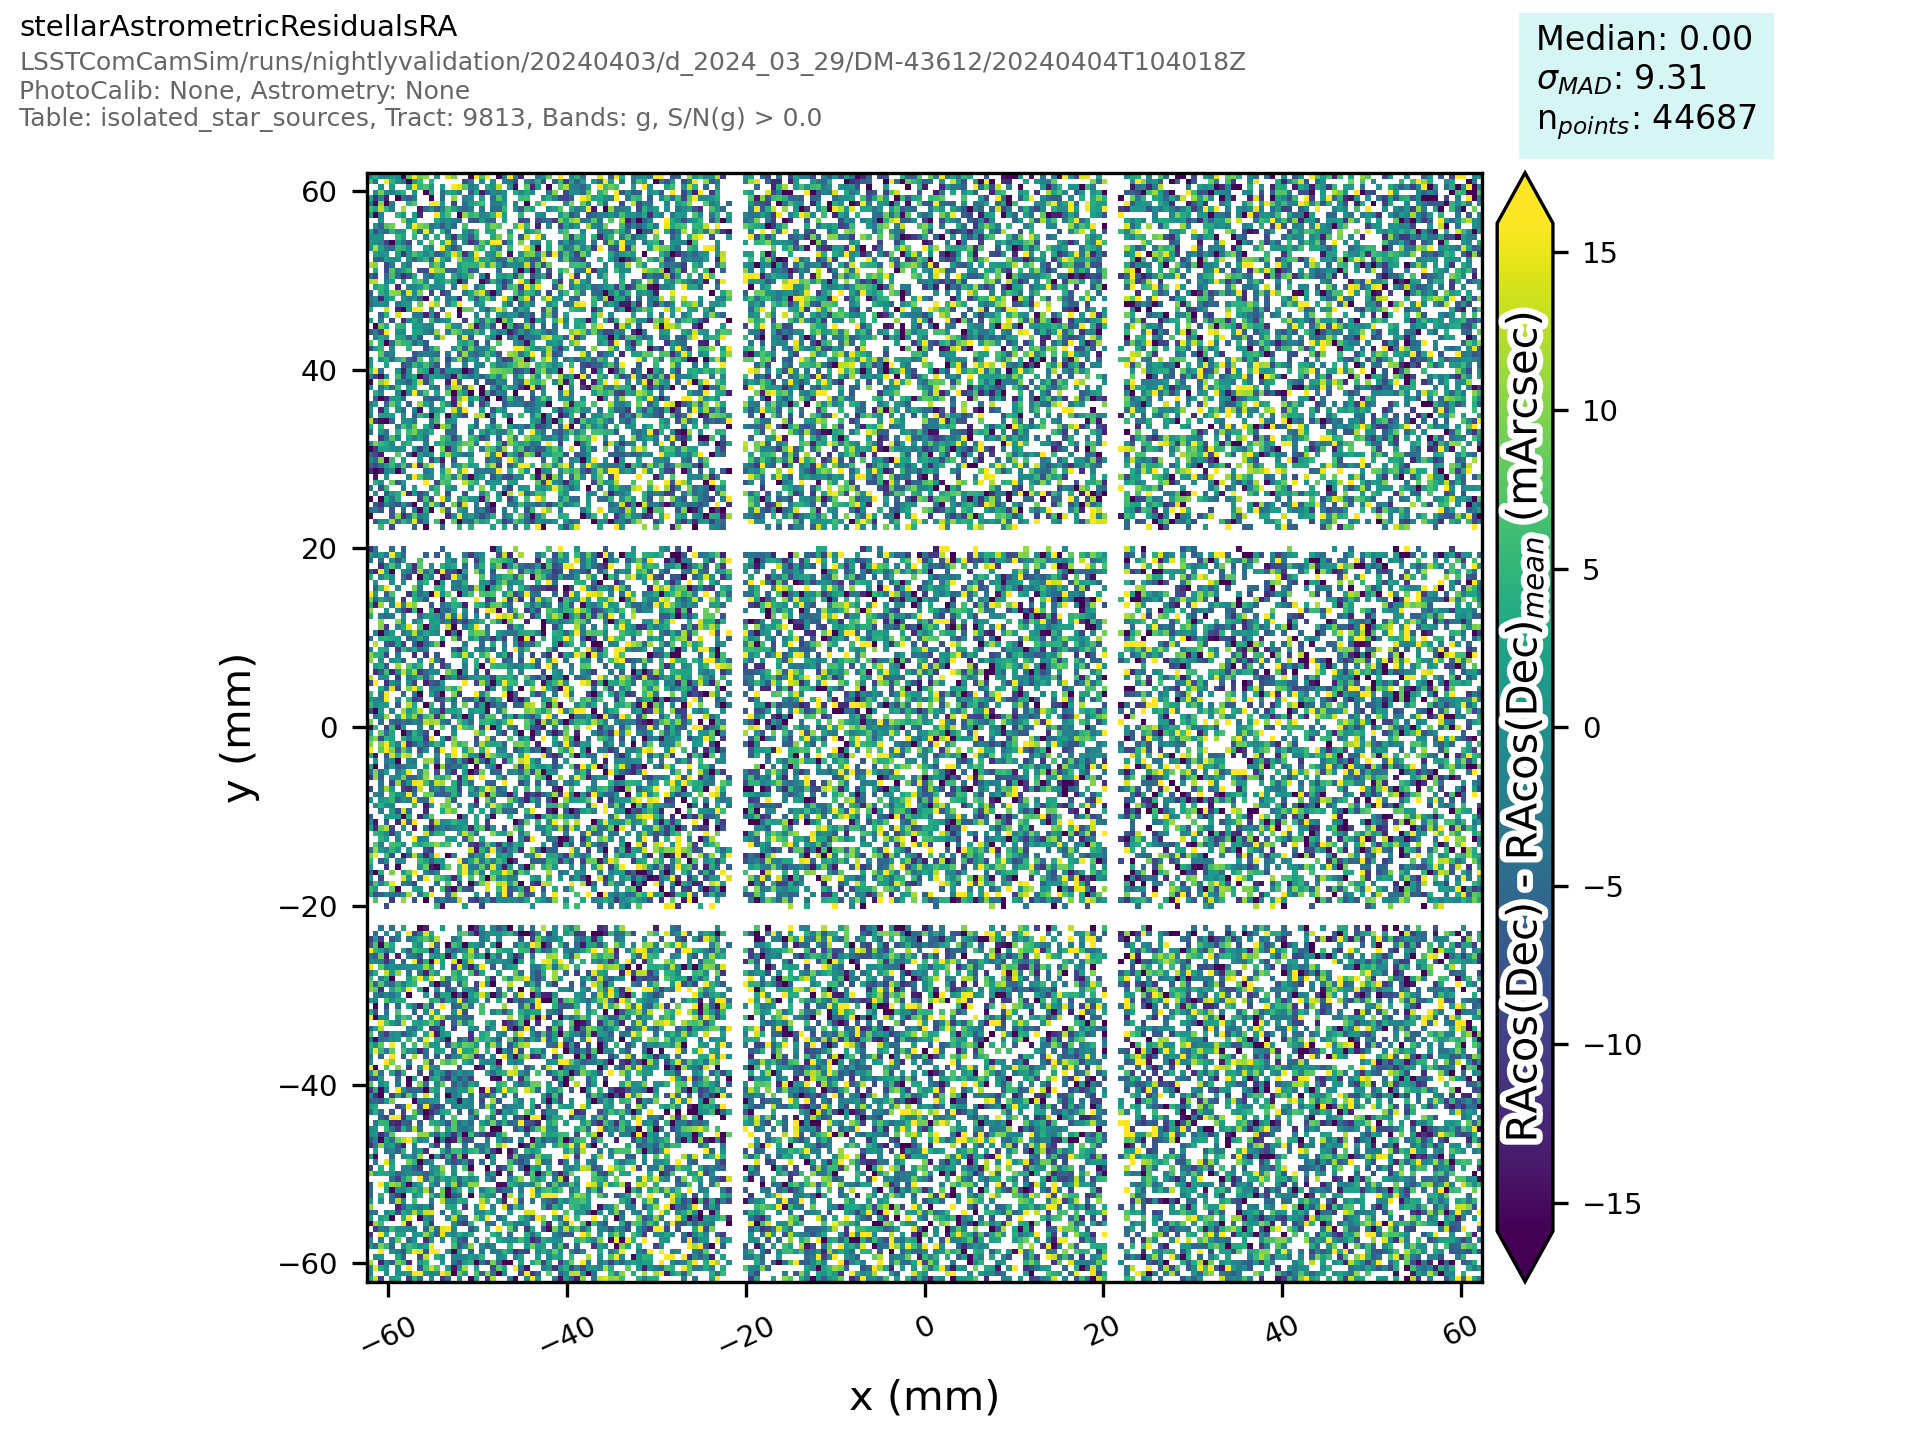
Fig. 5 Plot Name: matchedVisitCore_g_stellarAstrometricResidualsRA_FocalPlanePlot#
Associated metrics: matchedVisitCore_metrics
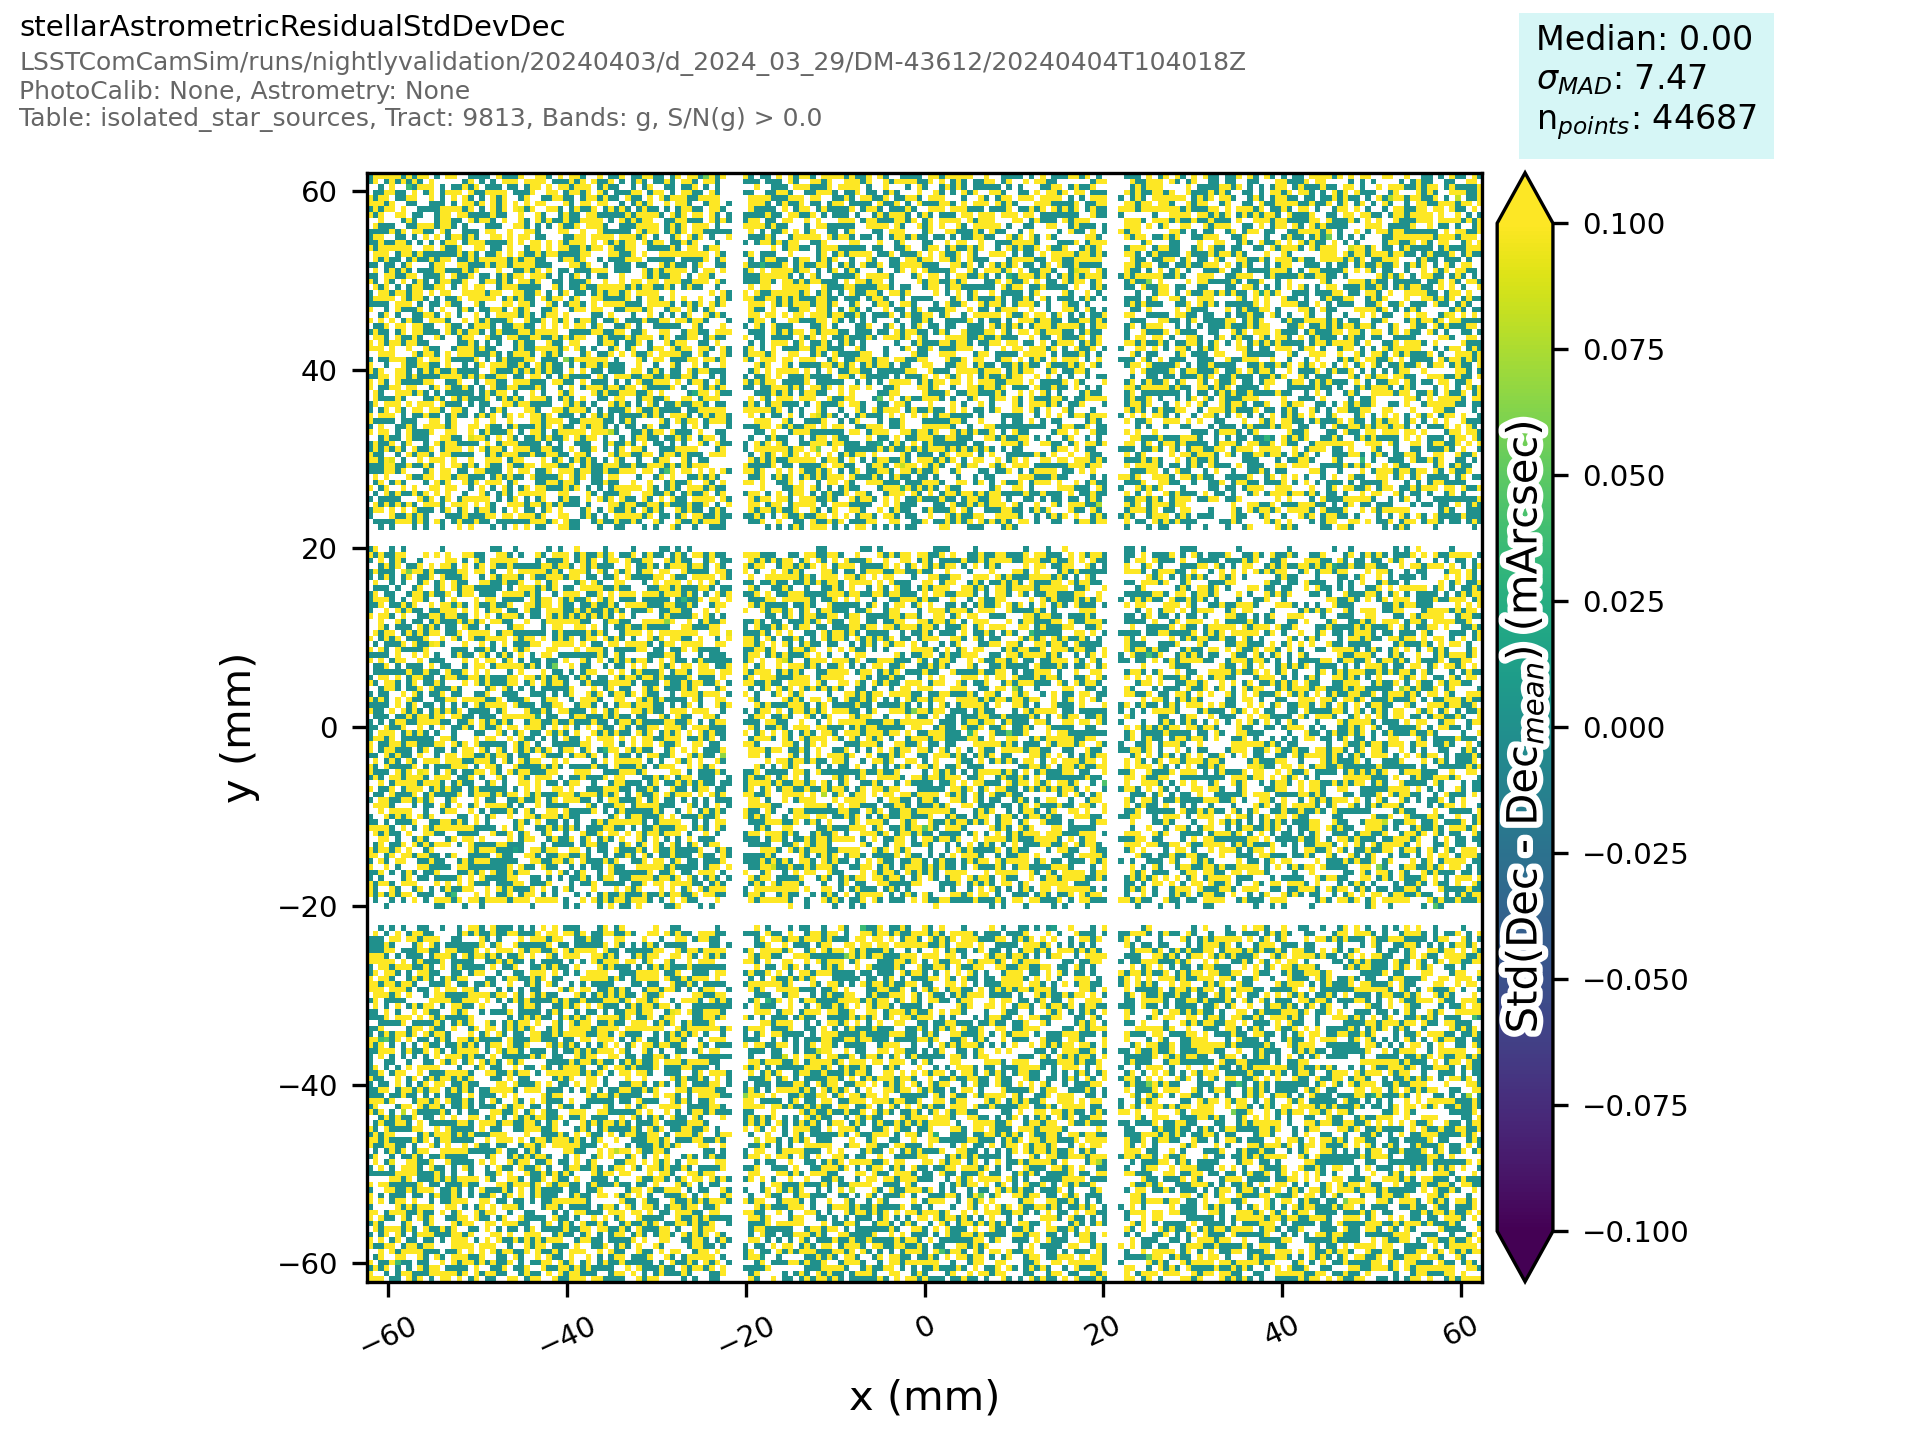
Fig. 6 Plot Name: matchedVisitCore_g_stellarAstrometricResidualStdDevDec_FocalPlanePlot#
Associated metrics: matchedVisitCore_metrics
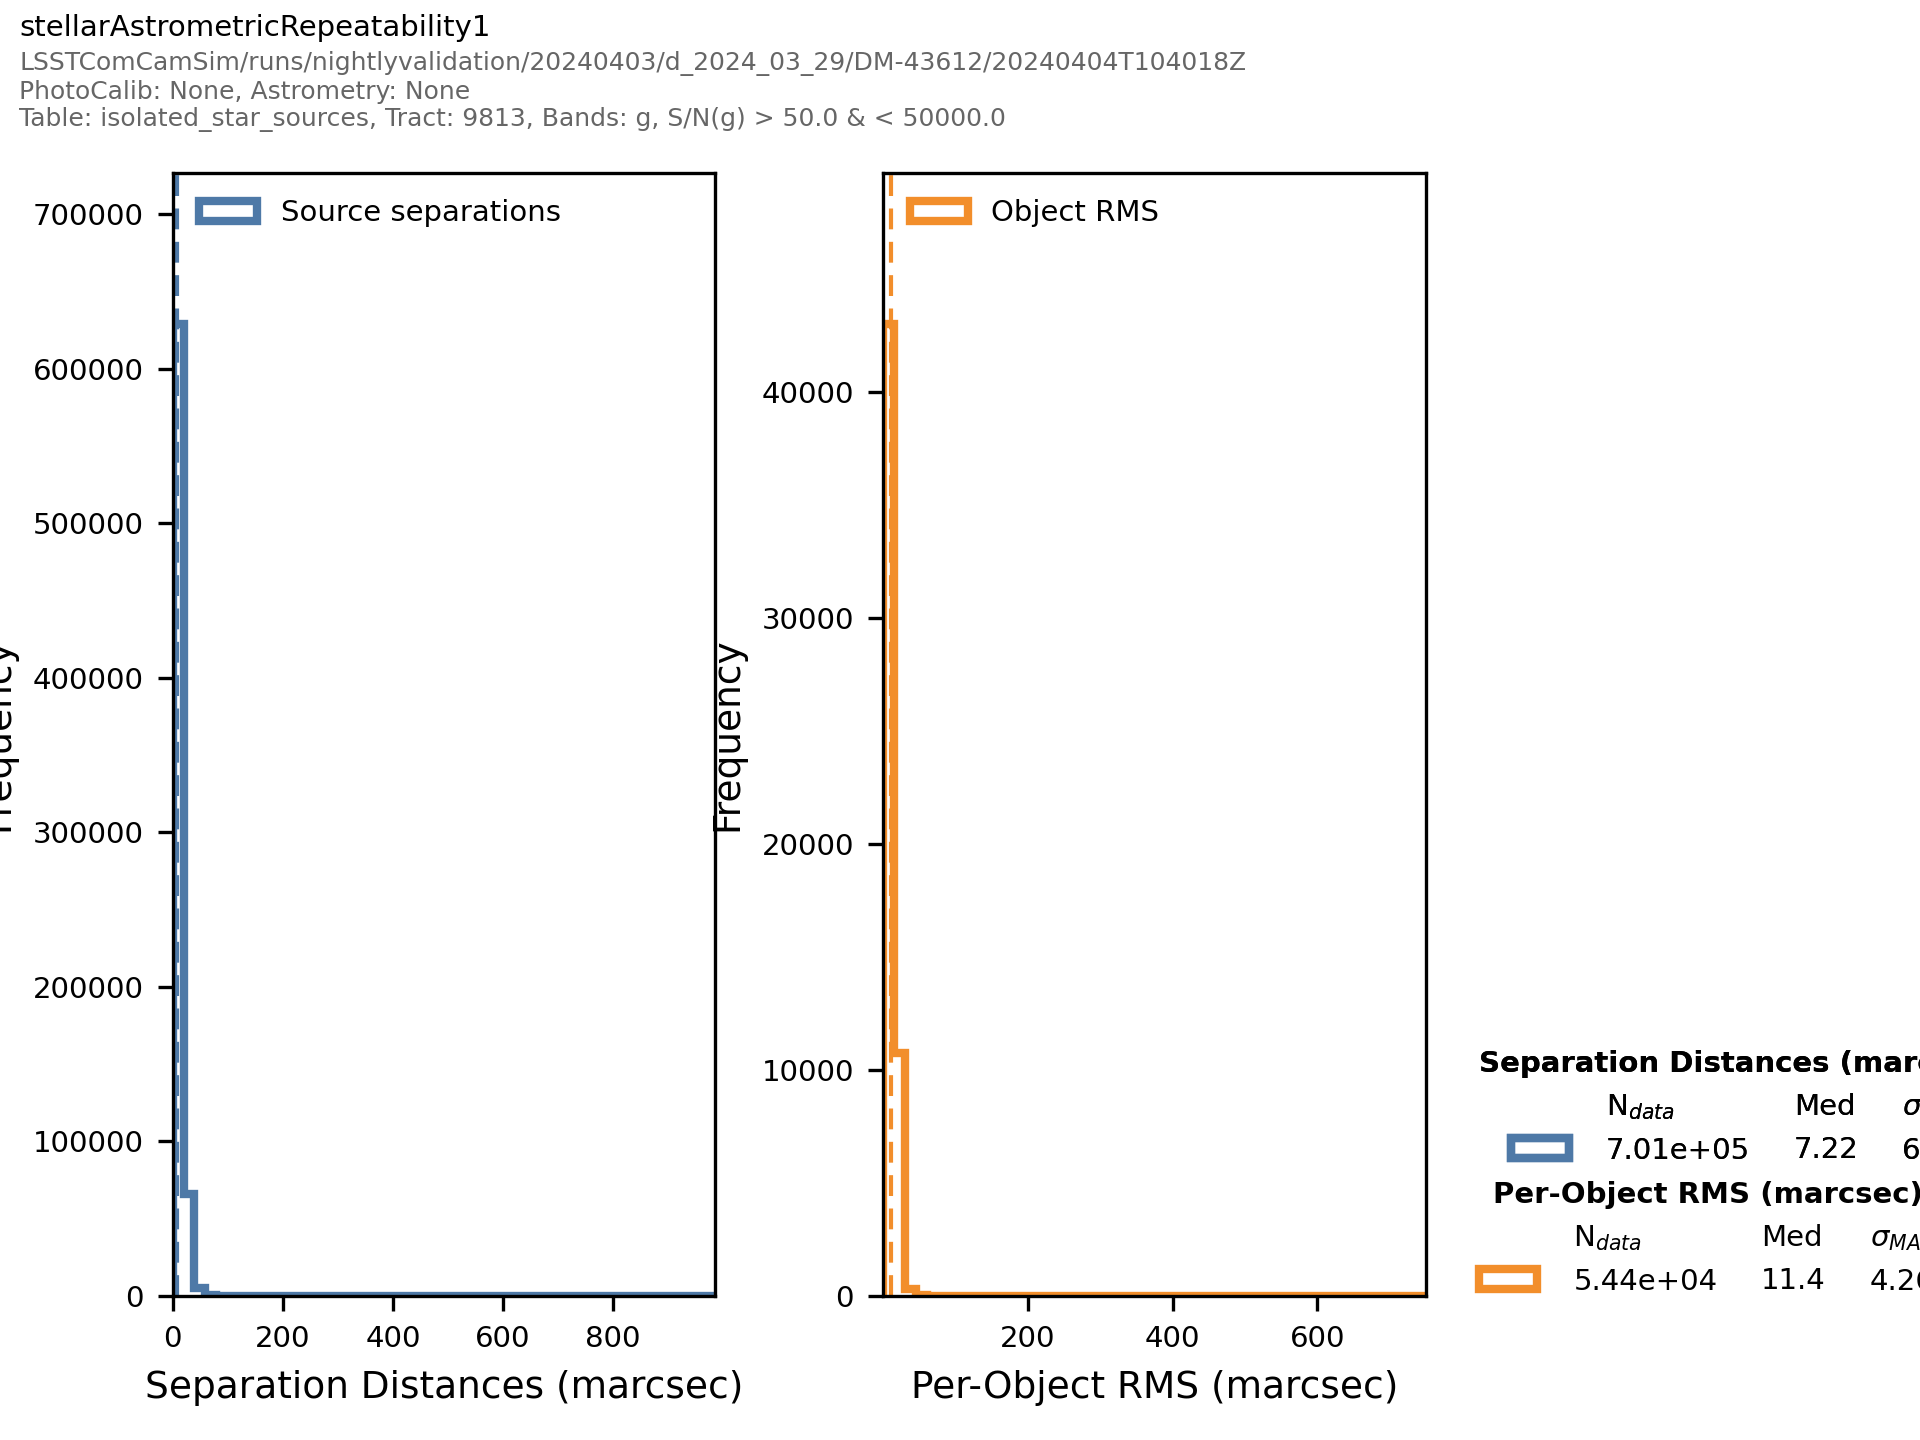
Fig. 7 Plot Name: matchedVisitCore_g_stellarAstrometricRepeatability1_HistPlot#
Associated metrics: matchedVisitCore_metrics
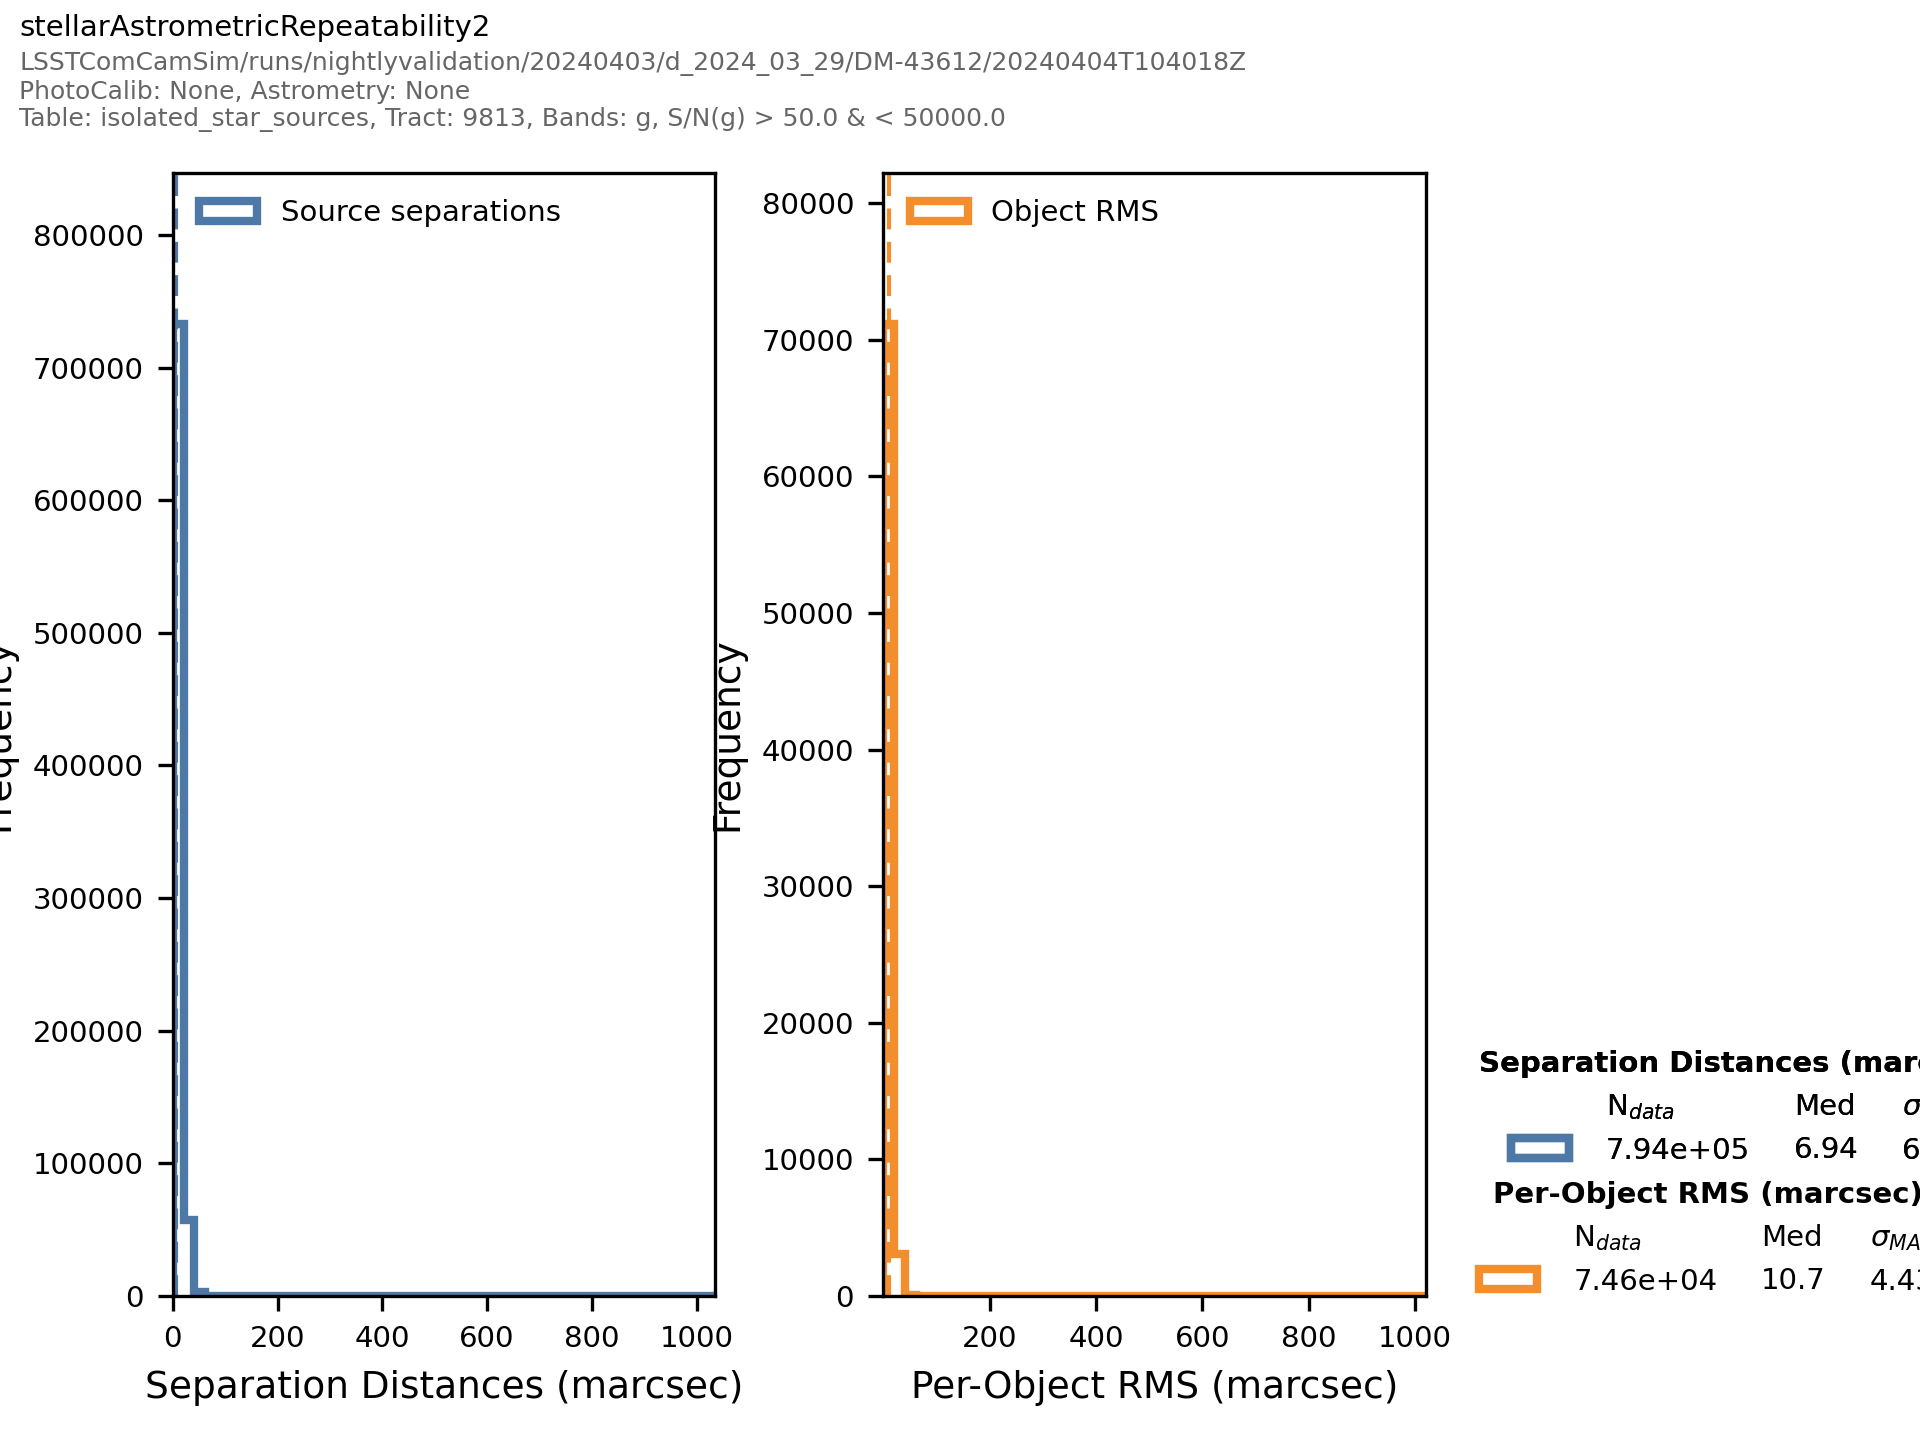
Fig. 8 Plot Name: matchedVisitCore_g_stellarAstrometricRepeatability2_HistPlot#
Associated metrics: matchedVisitCore_metrics
Fig. 9 Plot Name: matchedVisitCore_g_stellarAstrometricRepeatability3_HistPlot#
Associated metrics: matchedVisitCore_metrics
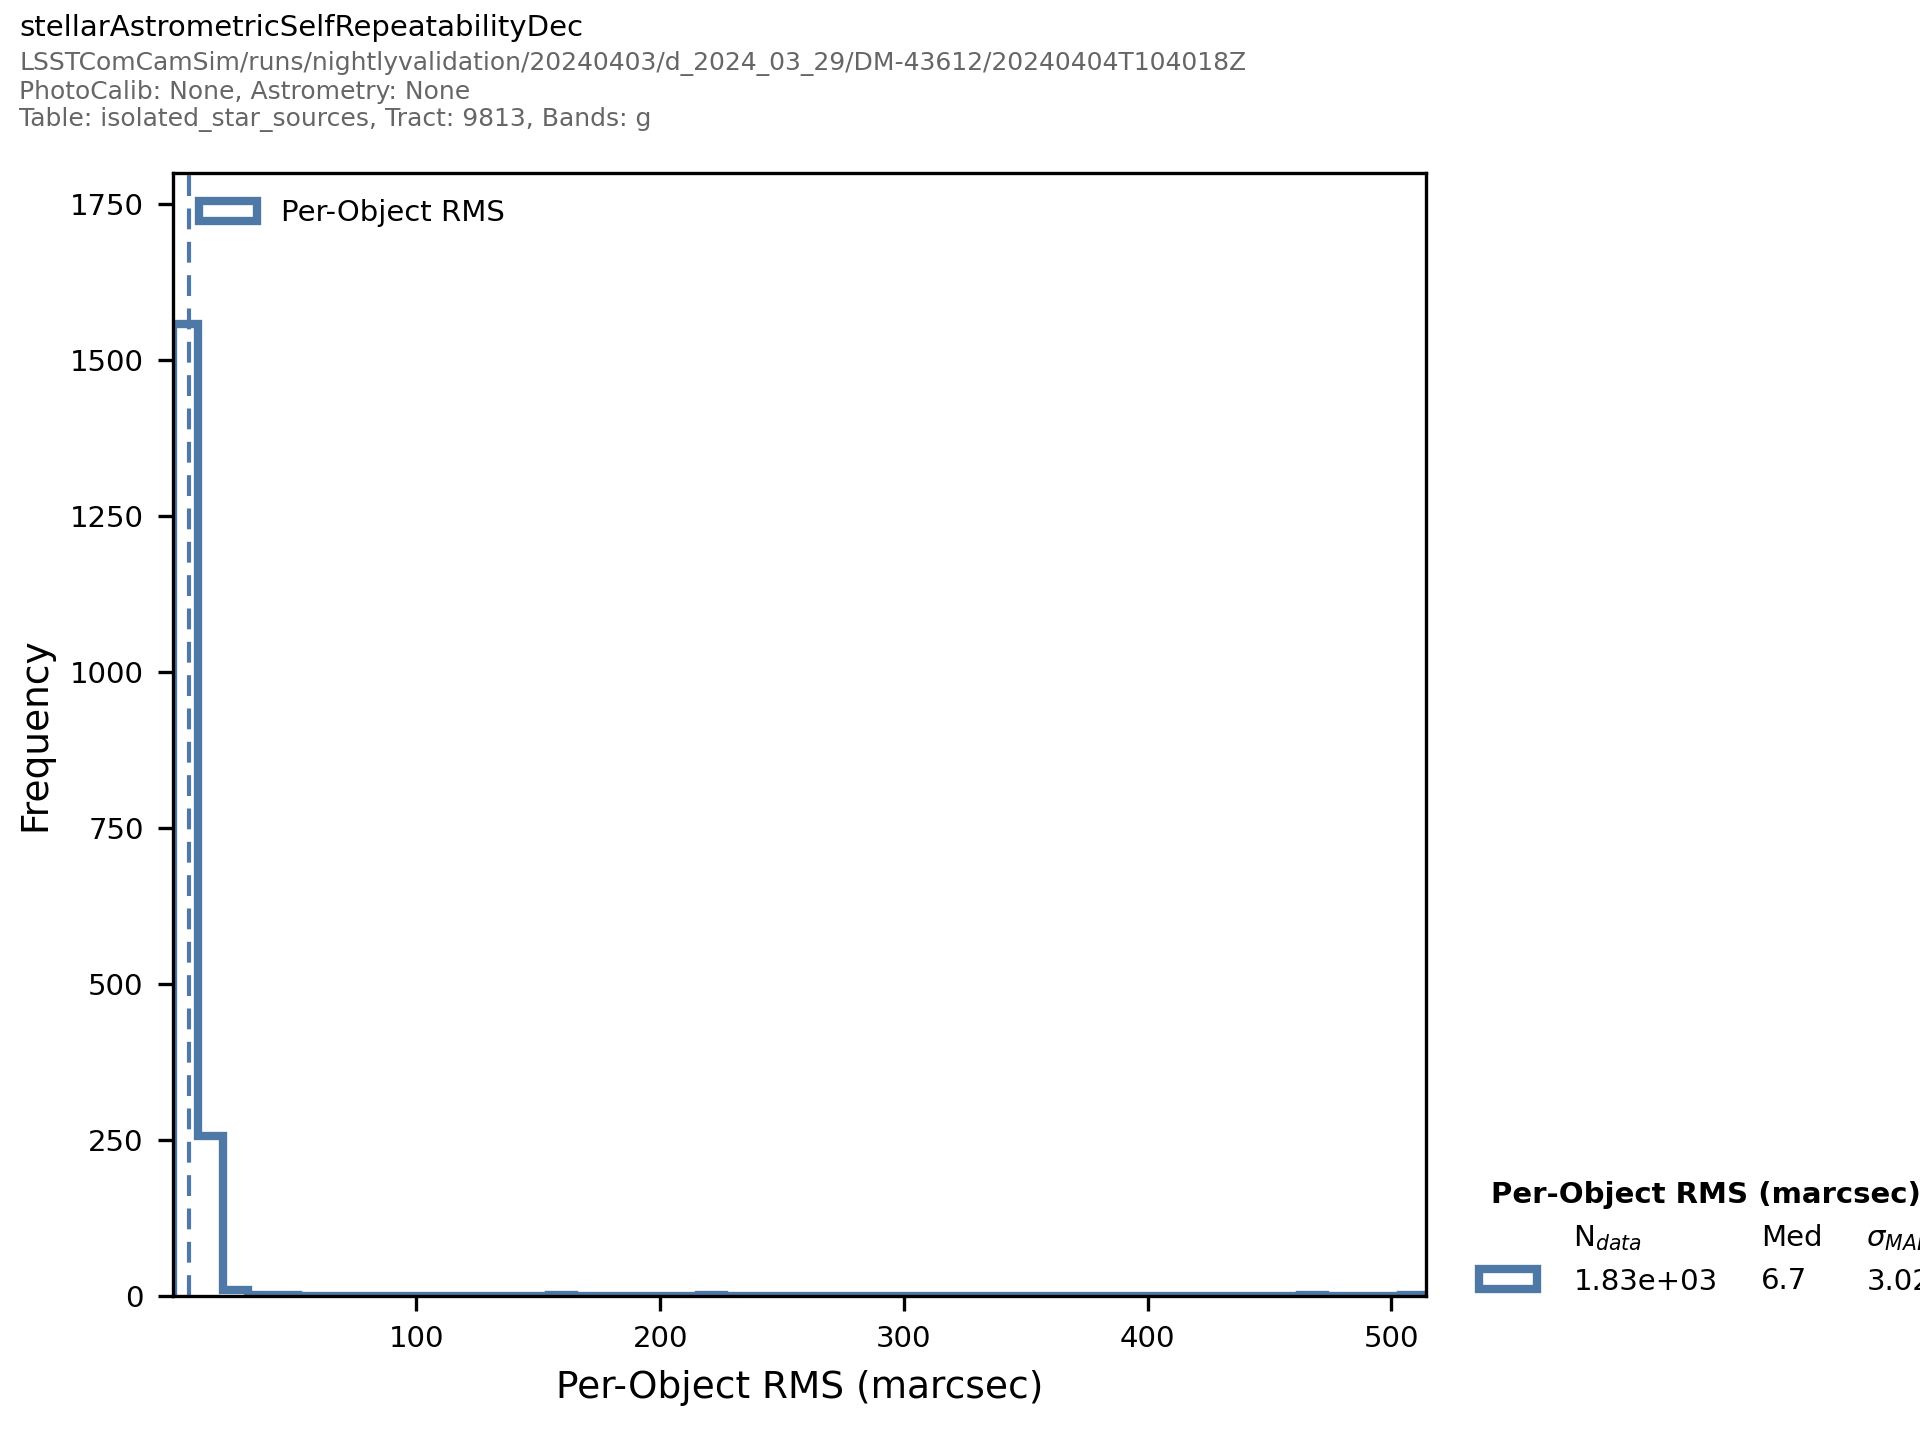
Fig. 10 Plot Name: matchedVisitCore_g_stellarAstrometricSelfRepeatabilityDec_HistPlot#
Associated metrics: matchedVisitCore_metrics
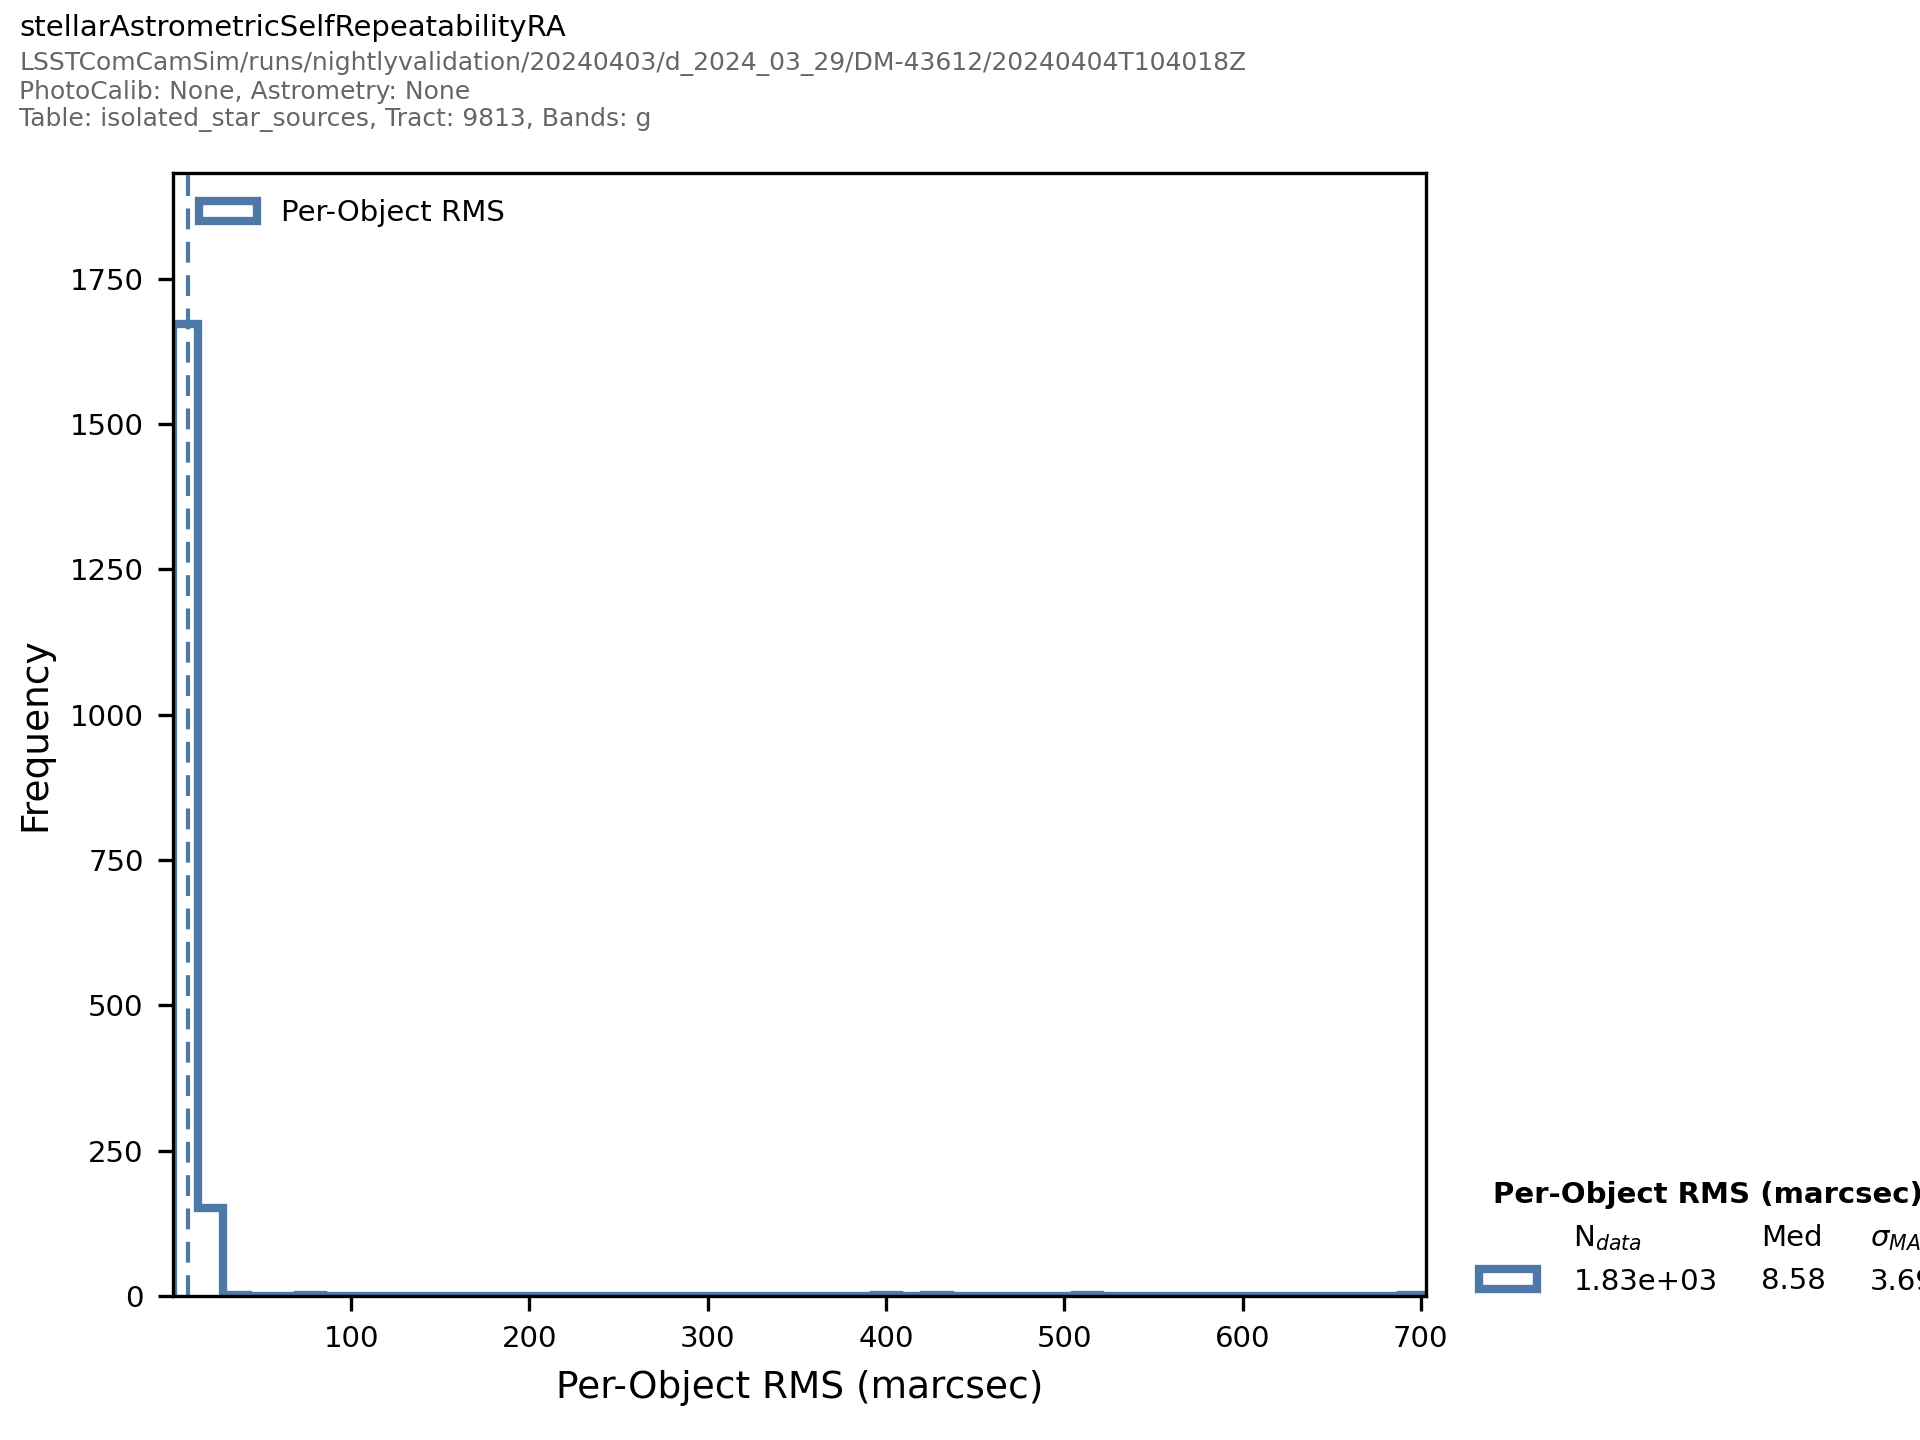
Fig. 11 Plot Name: matchedVisitCore_g_stellarAstrometricSelfRepeatabilityRA_HistPlot#
Associated metrics: matchedVisitCore_metrics
preSourceTableCore#
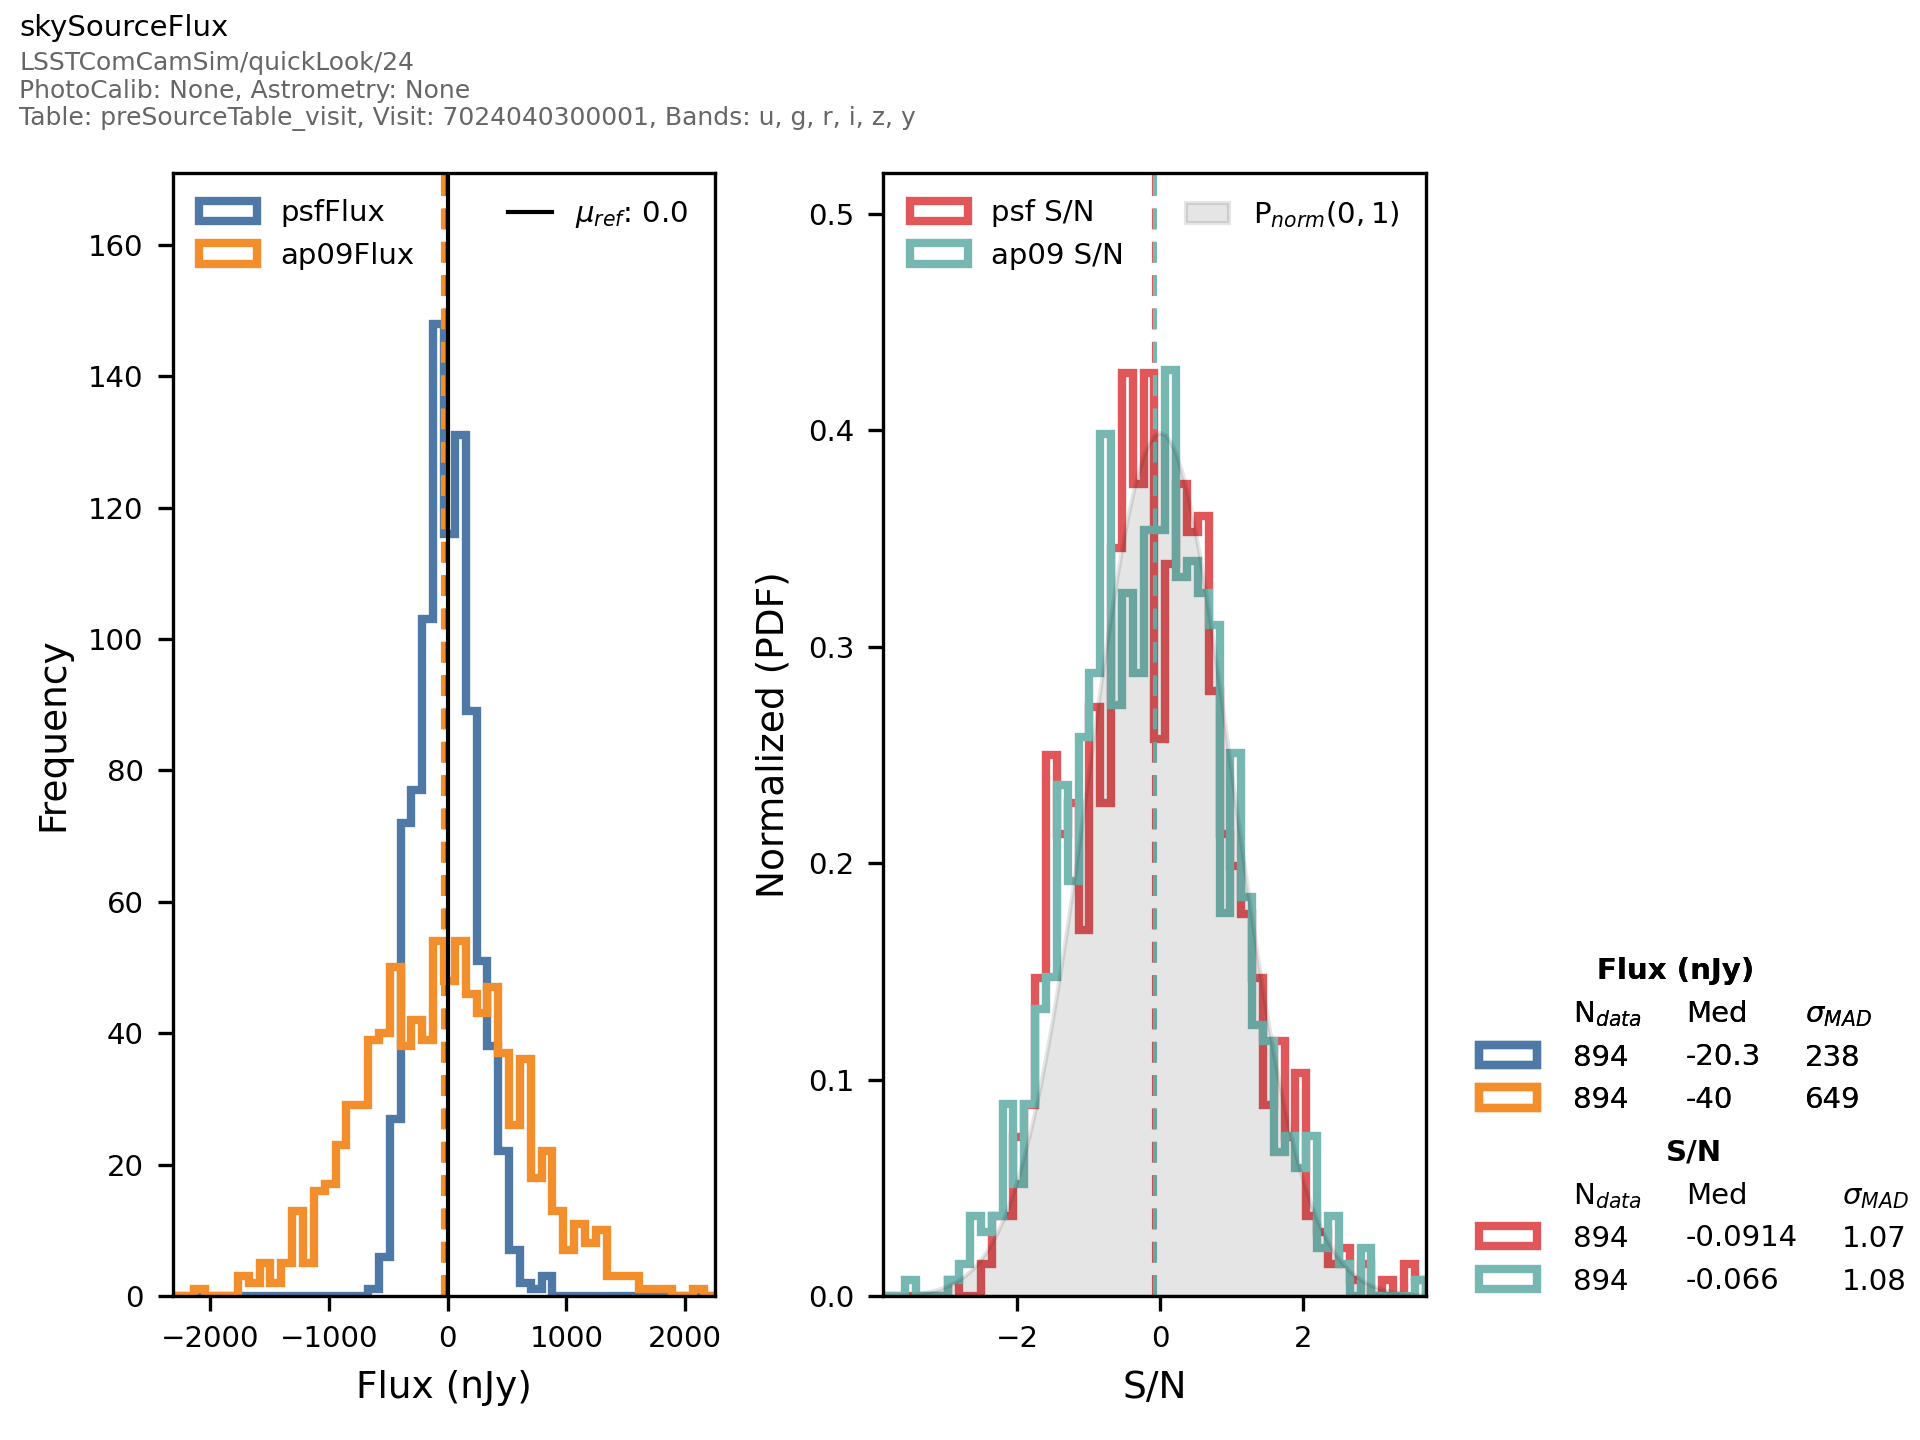
Fig. 12 Plot Name: preSourceTableCore_skySourceFlux_HistPlot#
Associated metrics: preSourceTableCore_metrics
Tract-level plots#
diaSourceTableTract#
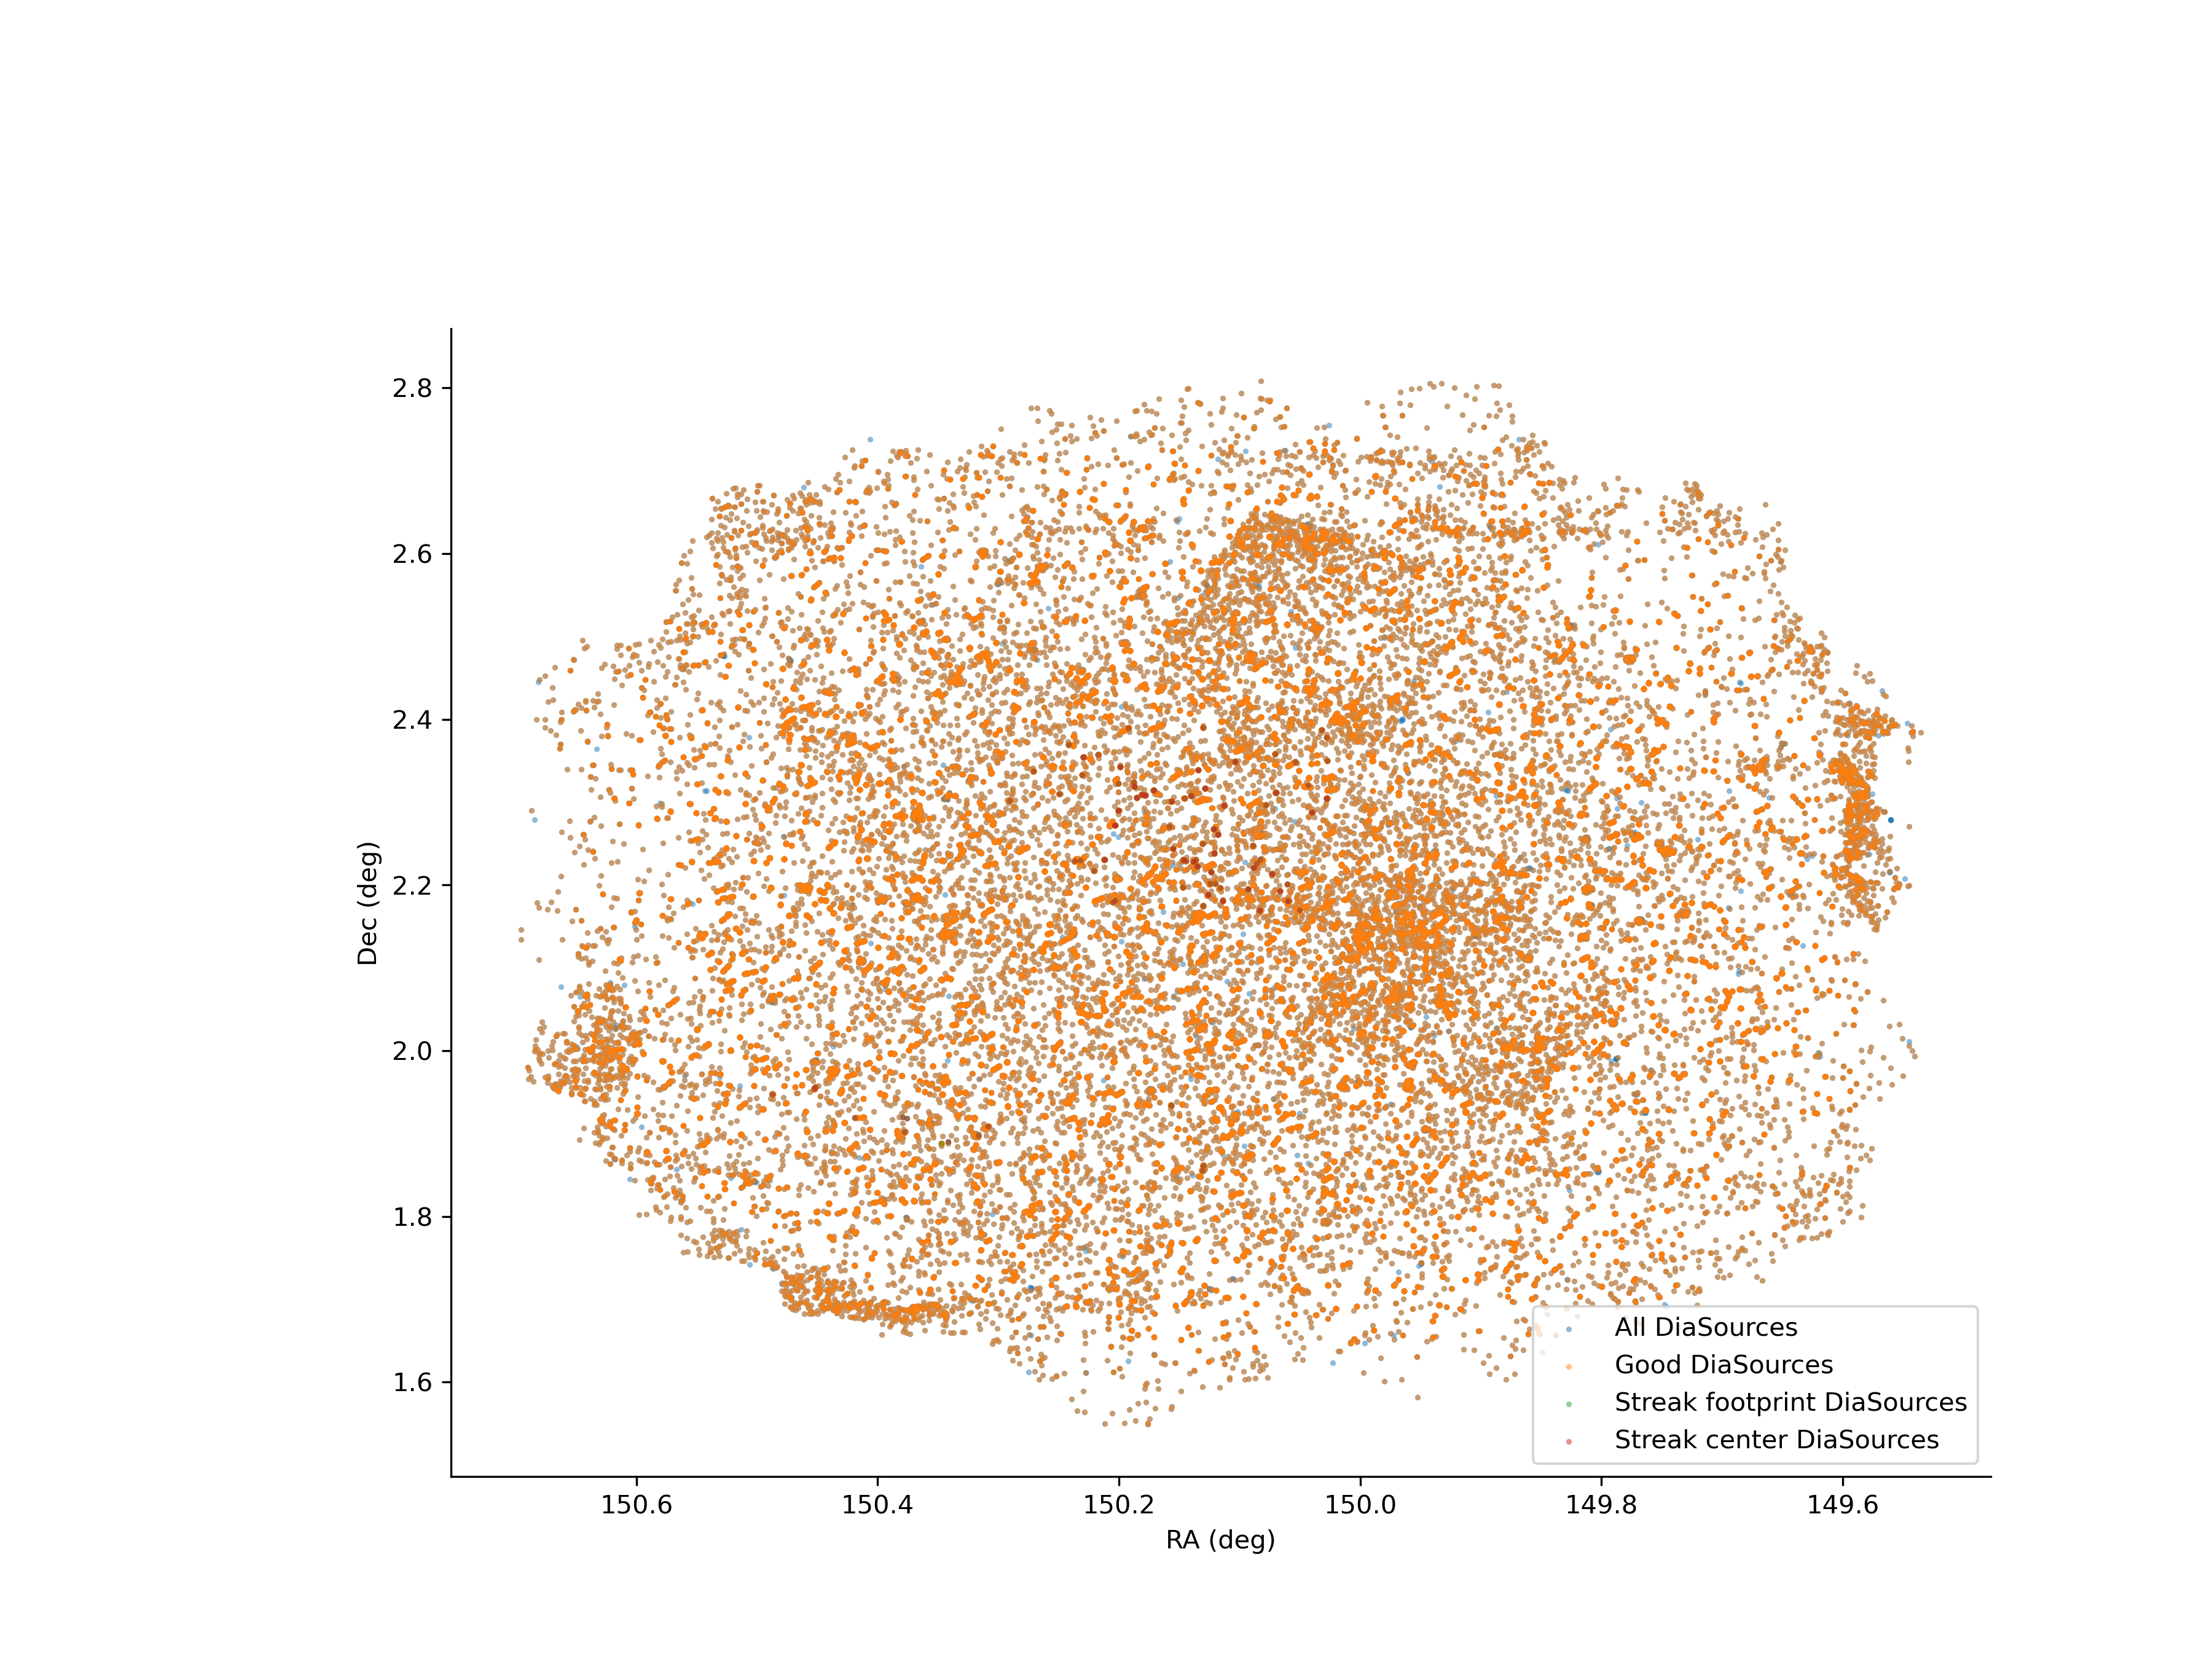
Fig. 13 Plot Name: diaSourceTableTract_streakDiaSourcePlot_DiaSkyPlot#
Associated metrics: diaSourceTableTract_metrics
objectTableCore#
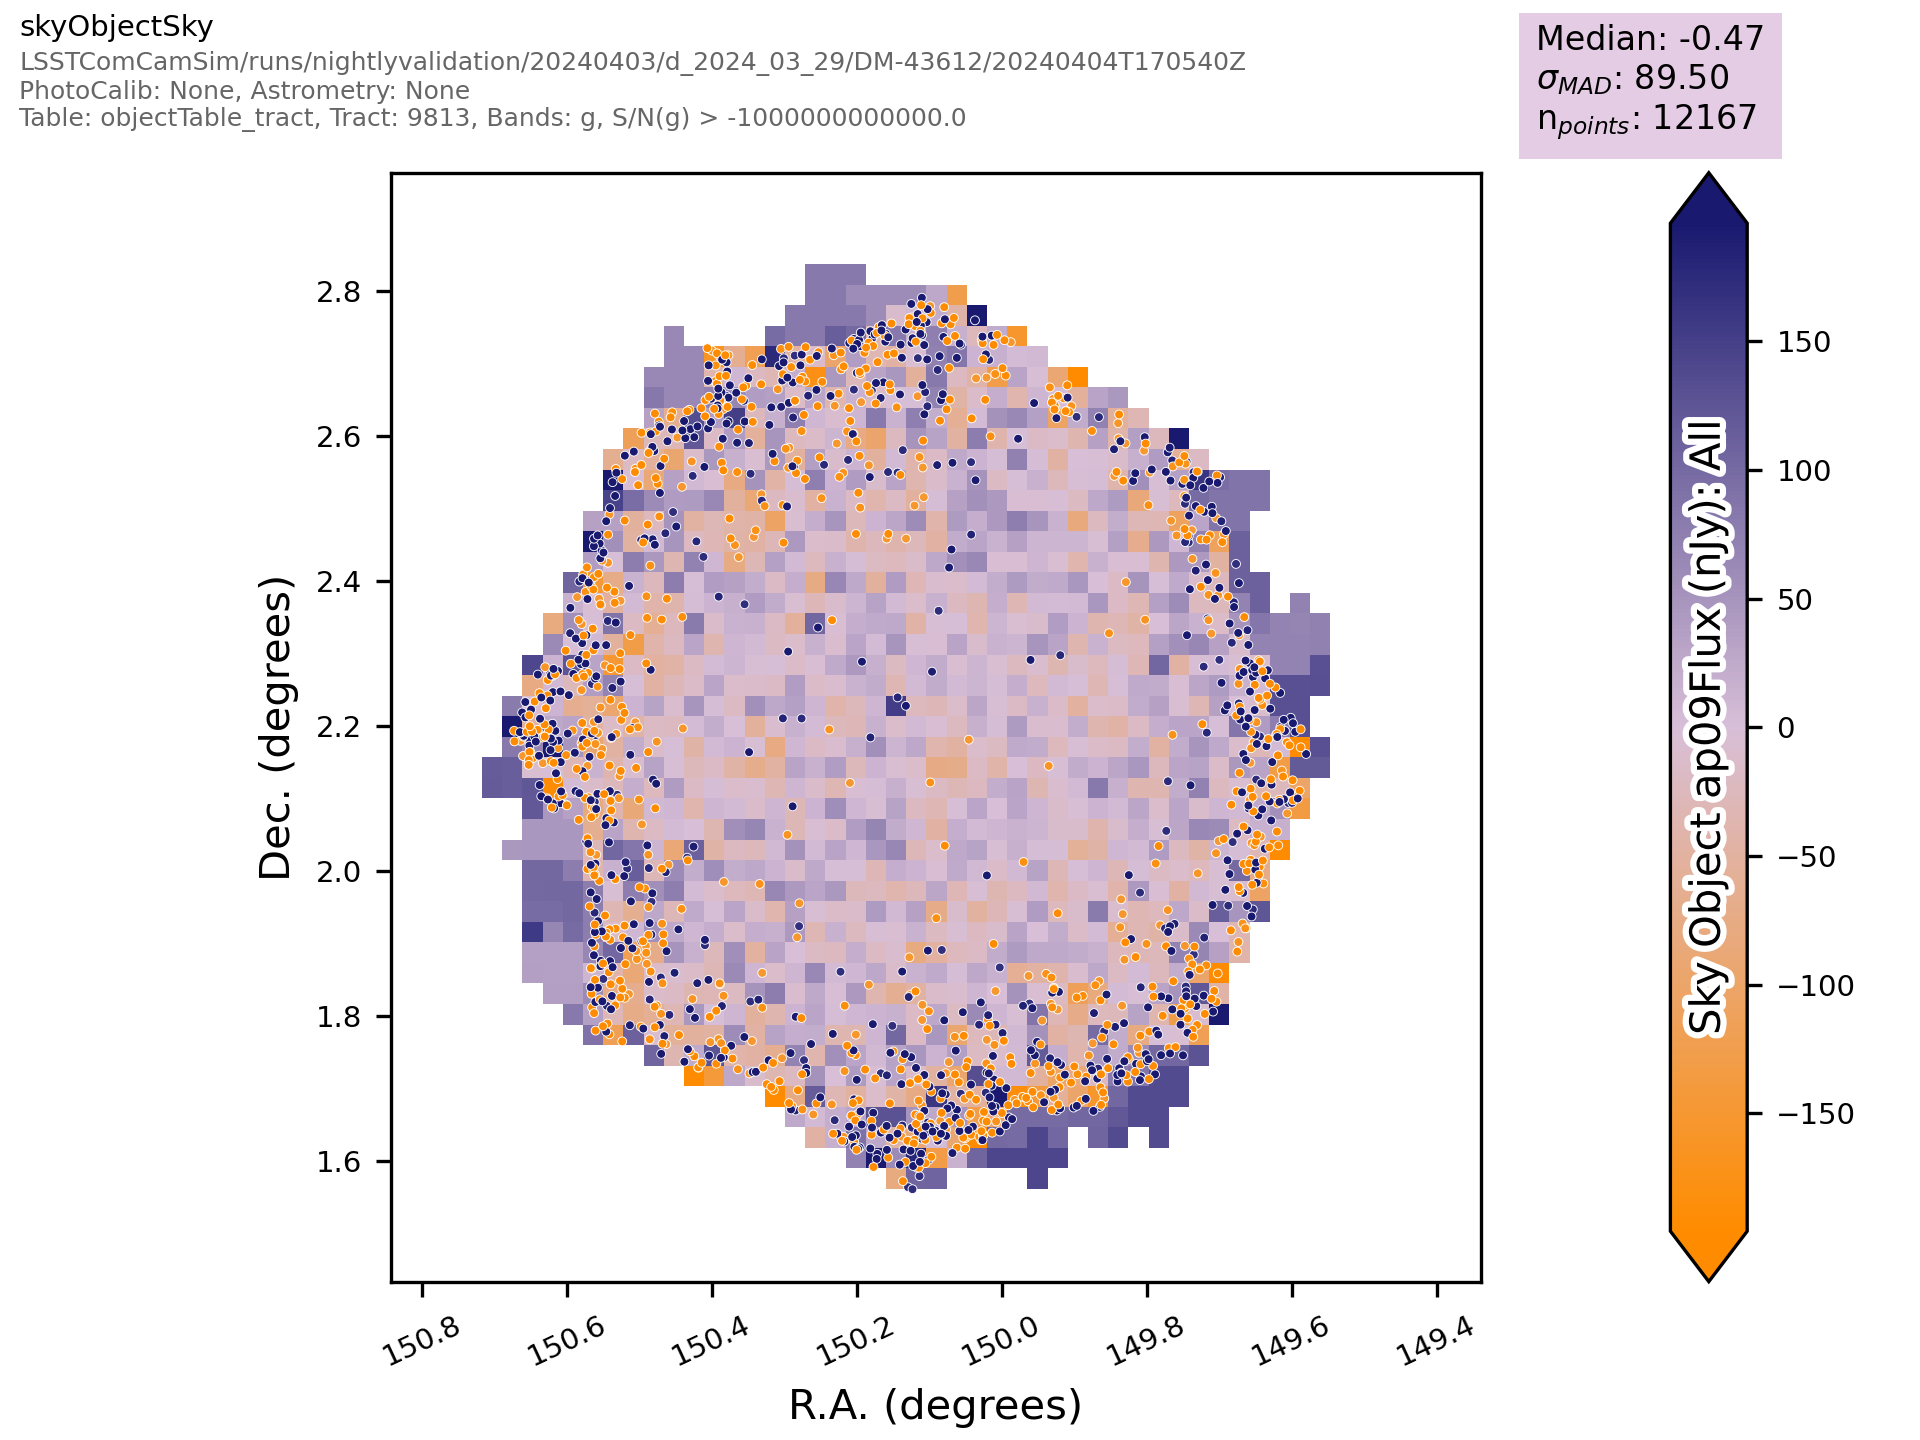
Fig. 14 Plot Name: objectTableCore_g_skyObjectSky_SkyPlot#
Associated metrics: objectTableCore_metrics
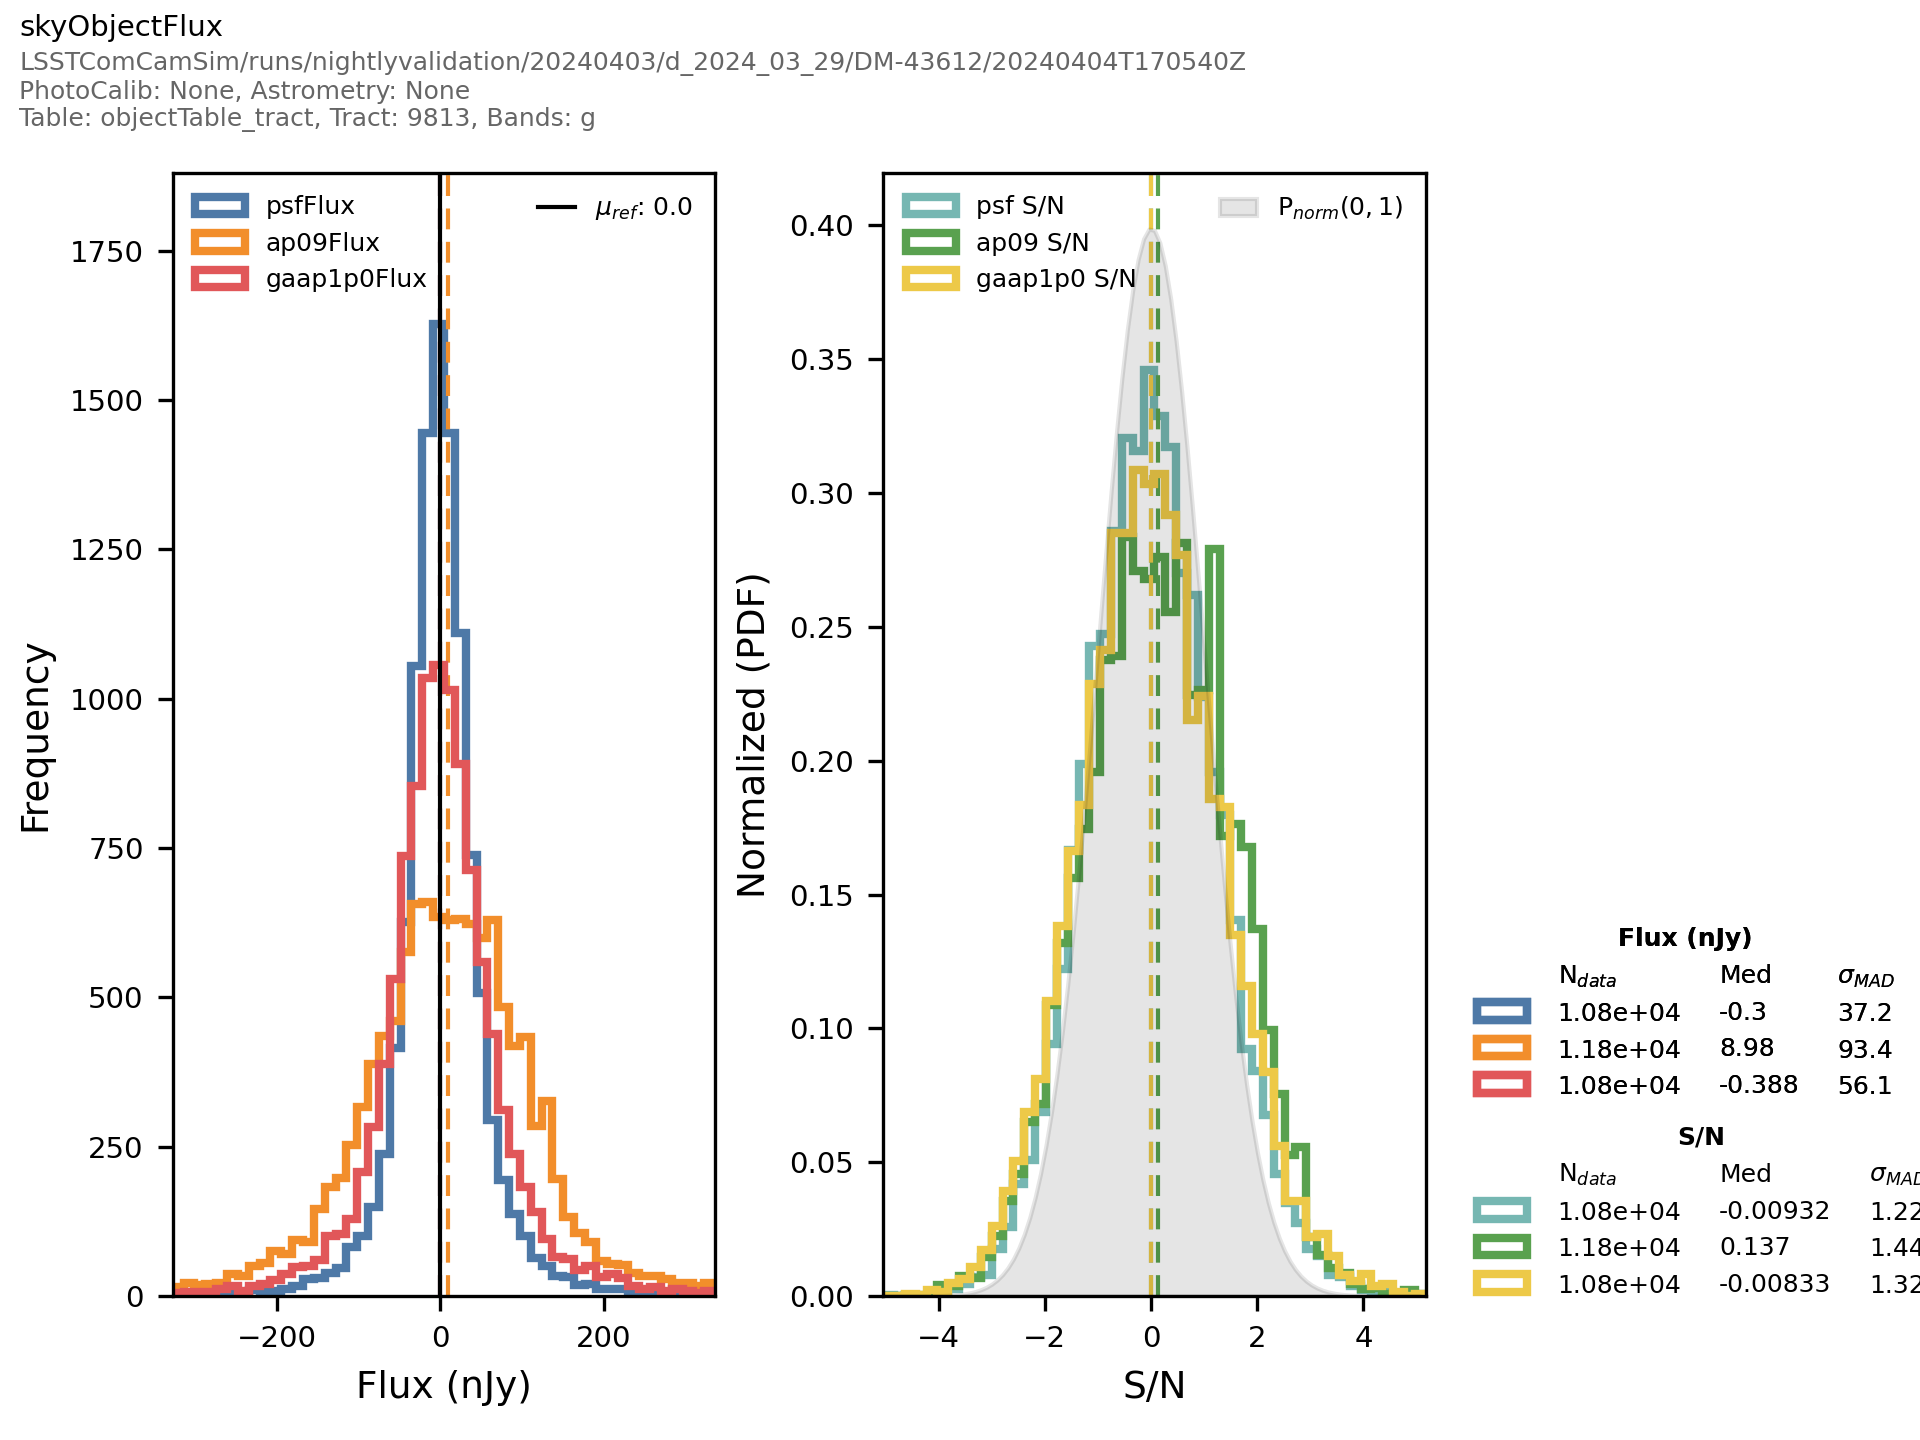
Fig. 15 Plot Name: objectTableCore_g_skyObjectFlux_HistPlot#
Associated metrics: objectTableCore_metrics
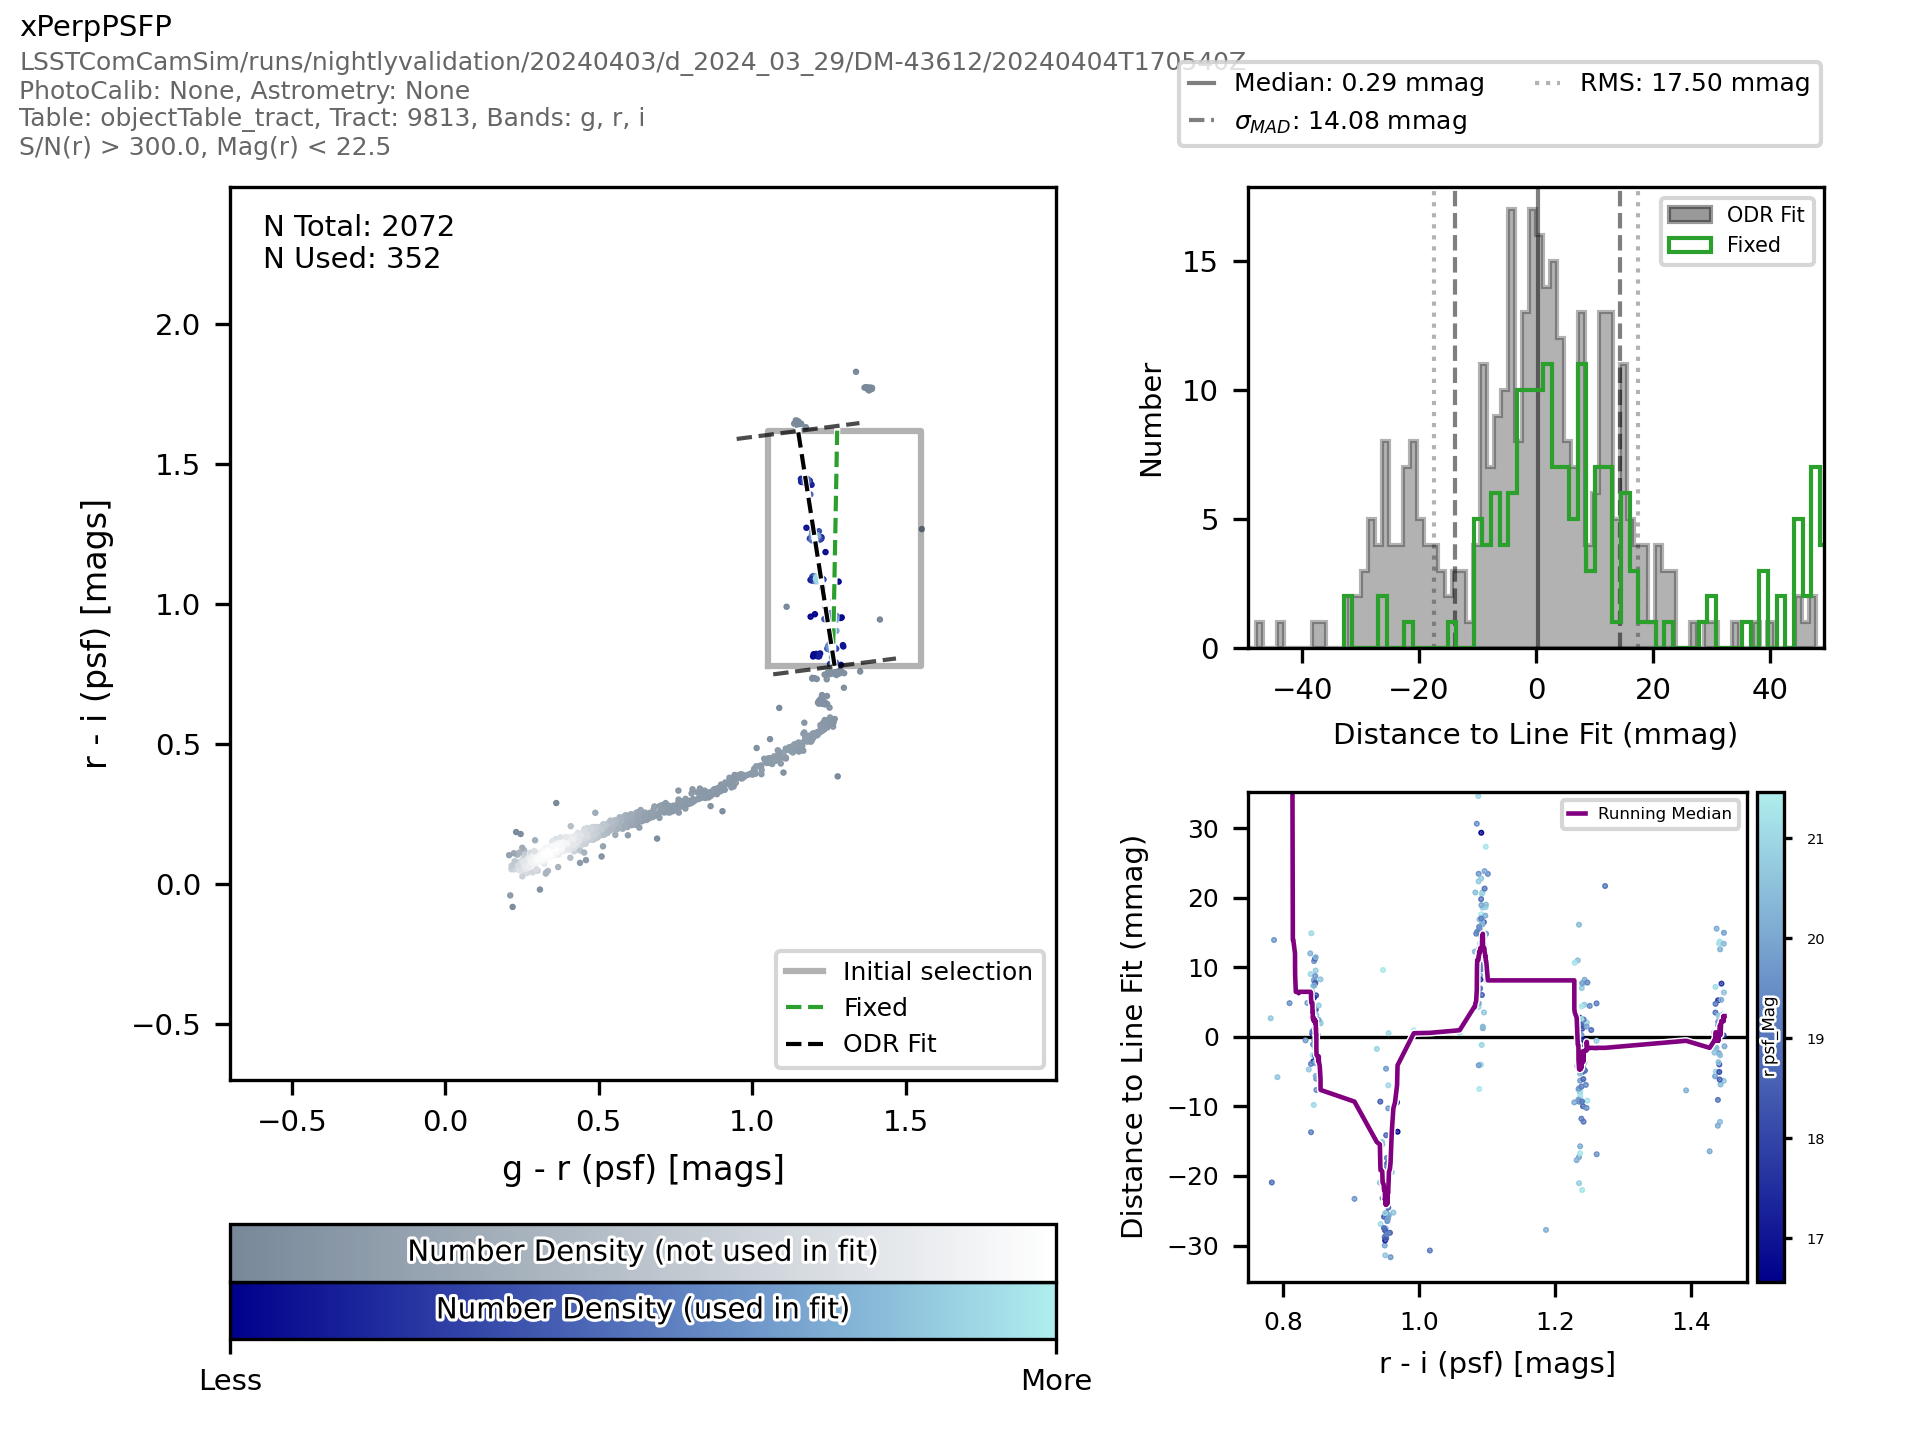
Fig. 16 Plot Name: objectTableCore_xPerpPSFP_ColorColorFitPlot#
Associated metrics: objectTableCore_metrics
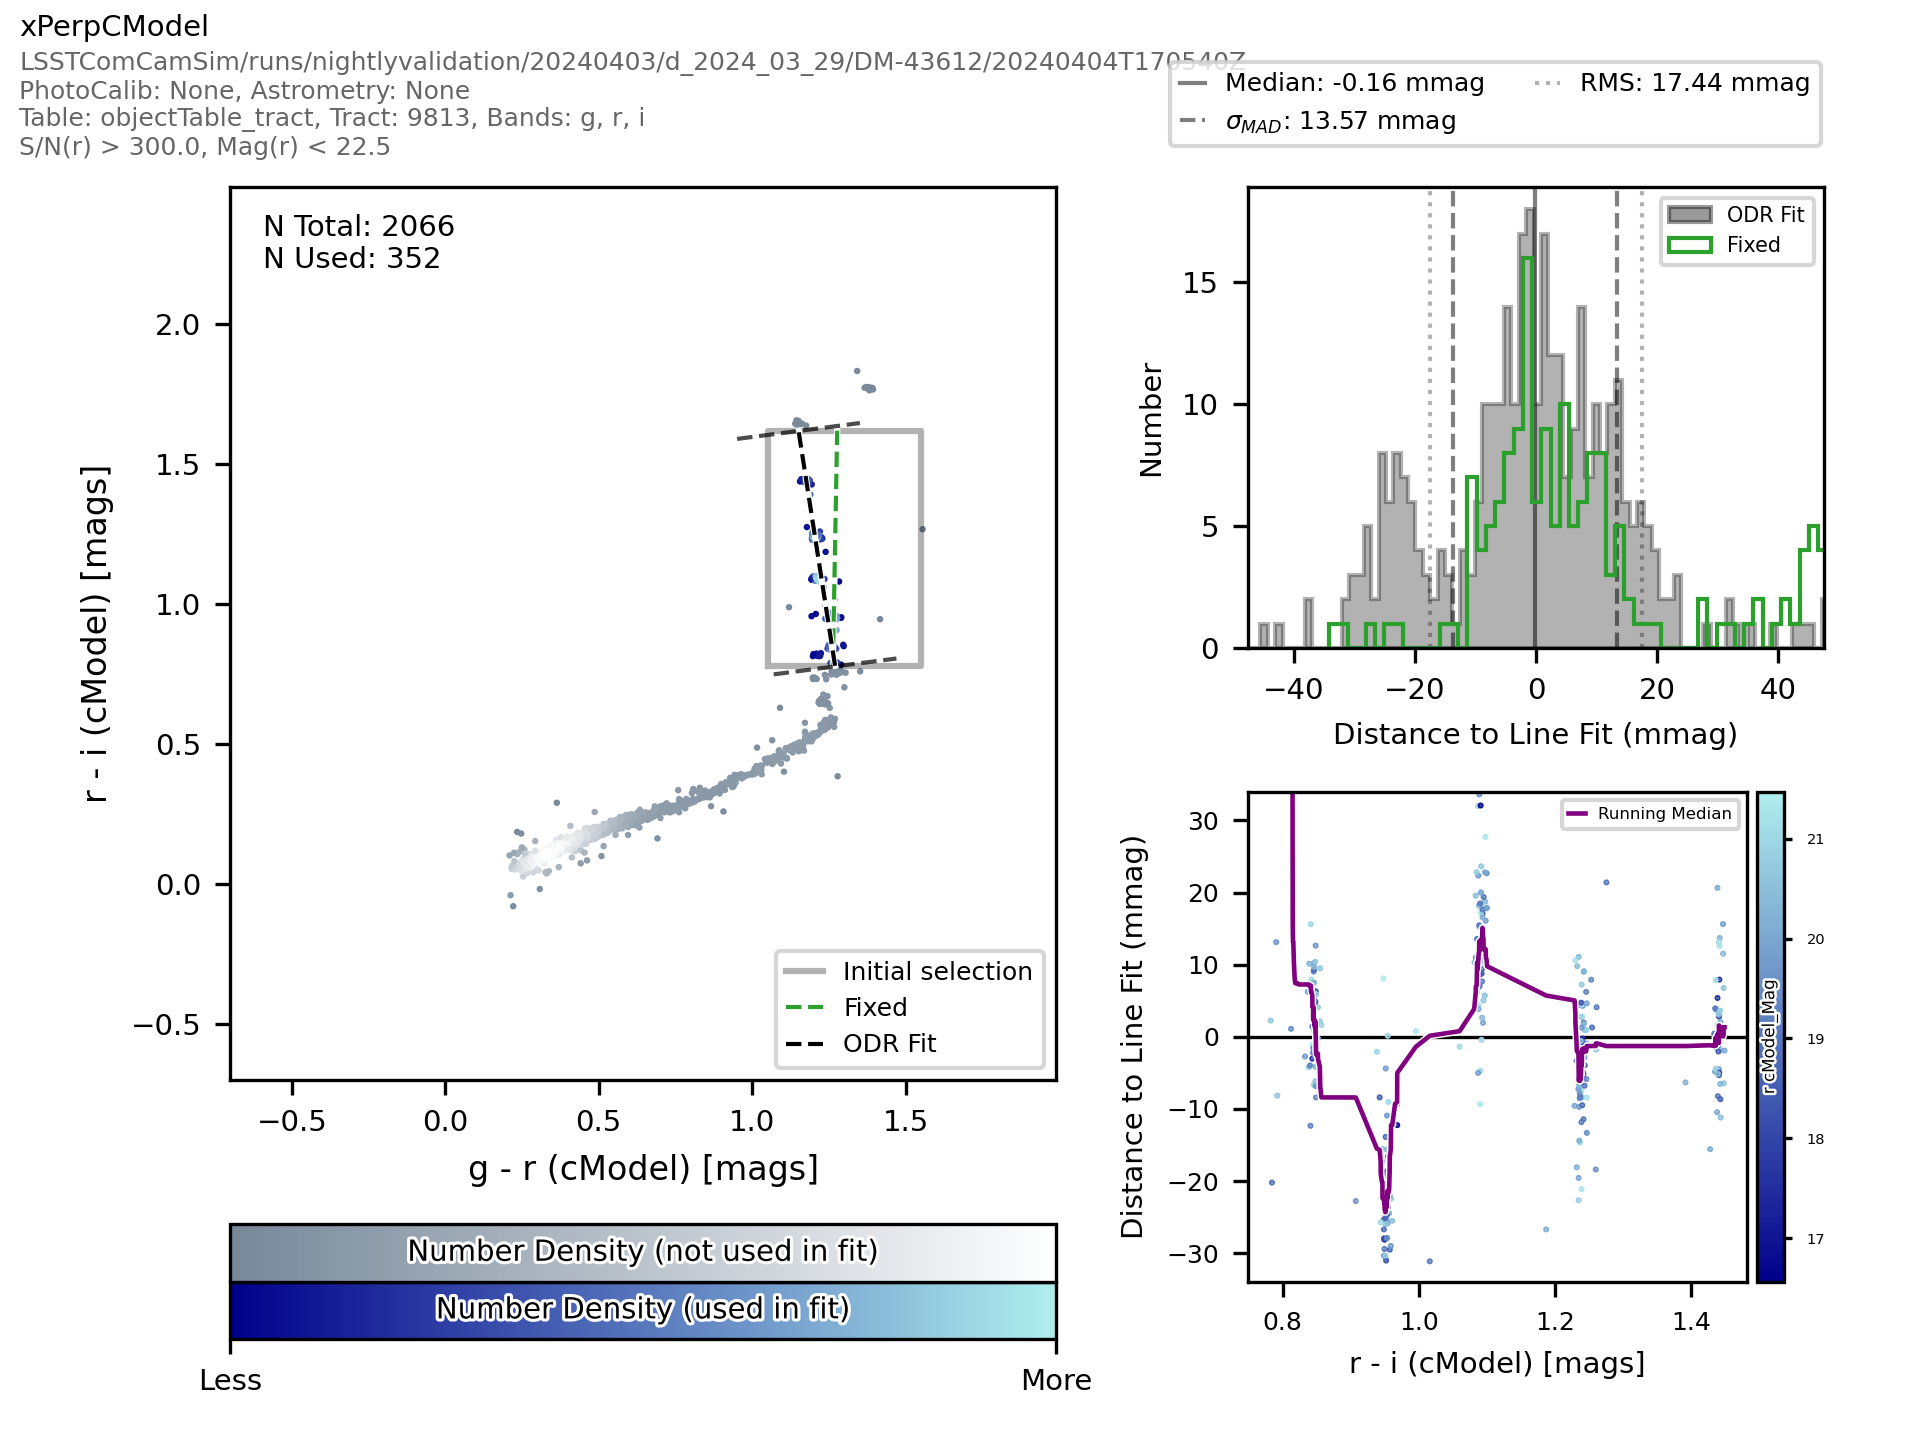
Fig. 17 Plot Name: objectTableCore_xPerpCModel_ColorColorFitPlot#
Associated metrics: objectTableCore_metrics

Fig. 18 Plot Name: objectTableCore_wPerpPSFP_ColorColorFitPlot#
Associated metrics: objectTableCore_metrics
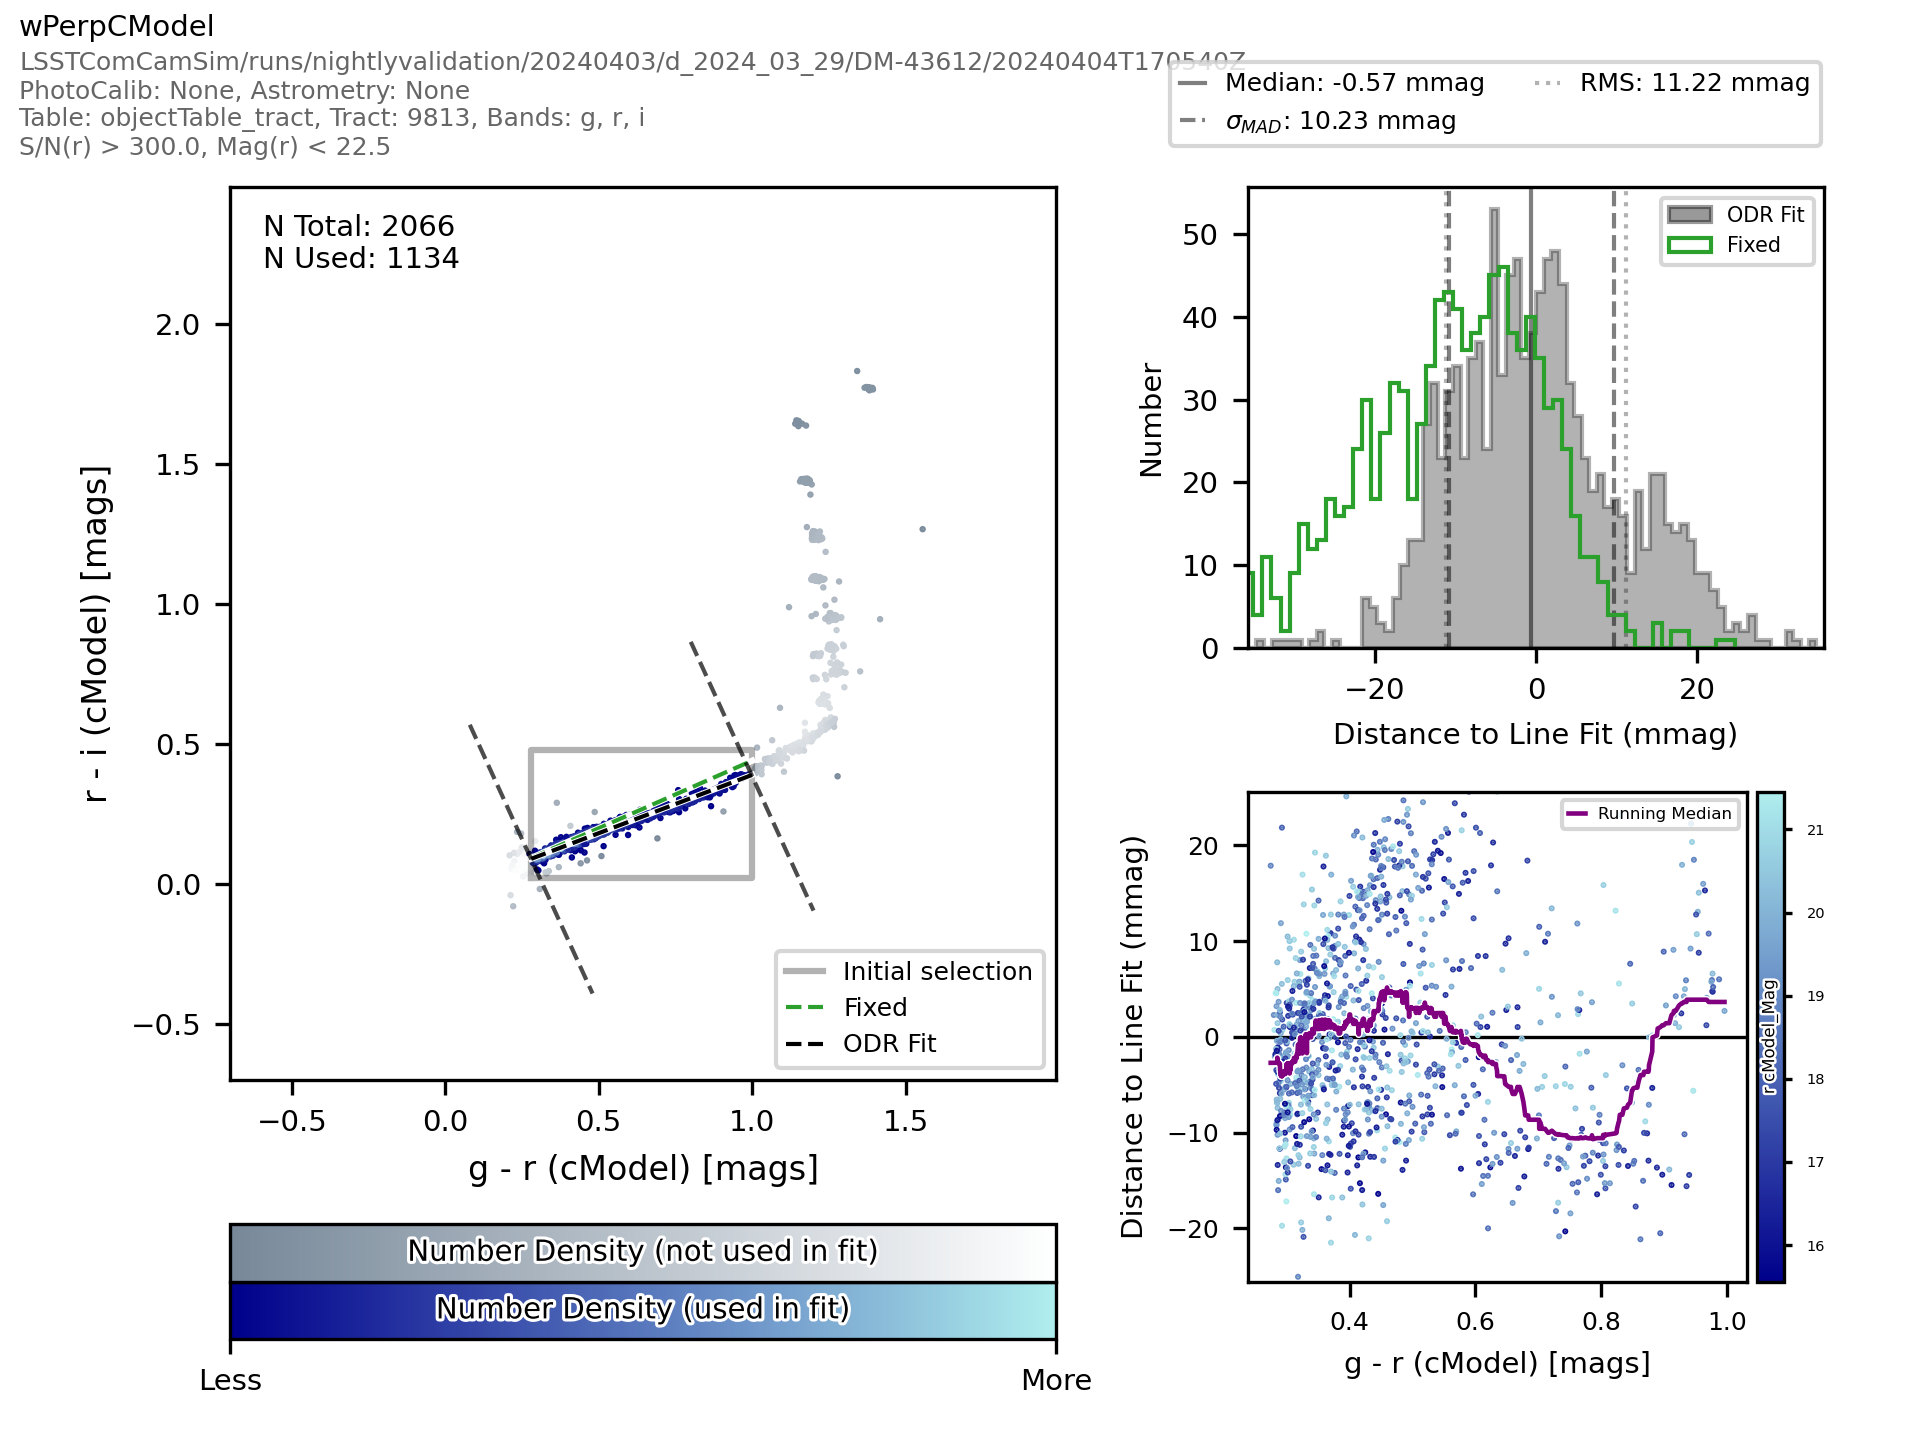
Fig. 19 Plot Name: objectTableCore_wPerpCModel_ColorColorFitPlot#
Associated metrics: objectTableCore_metrics
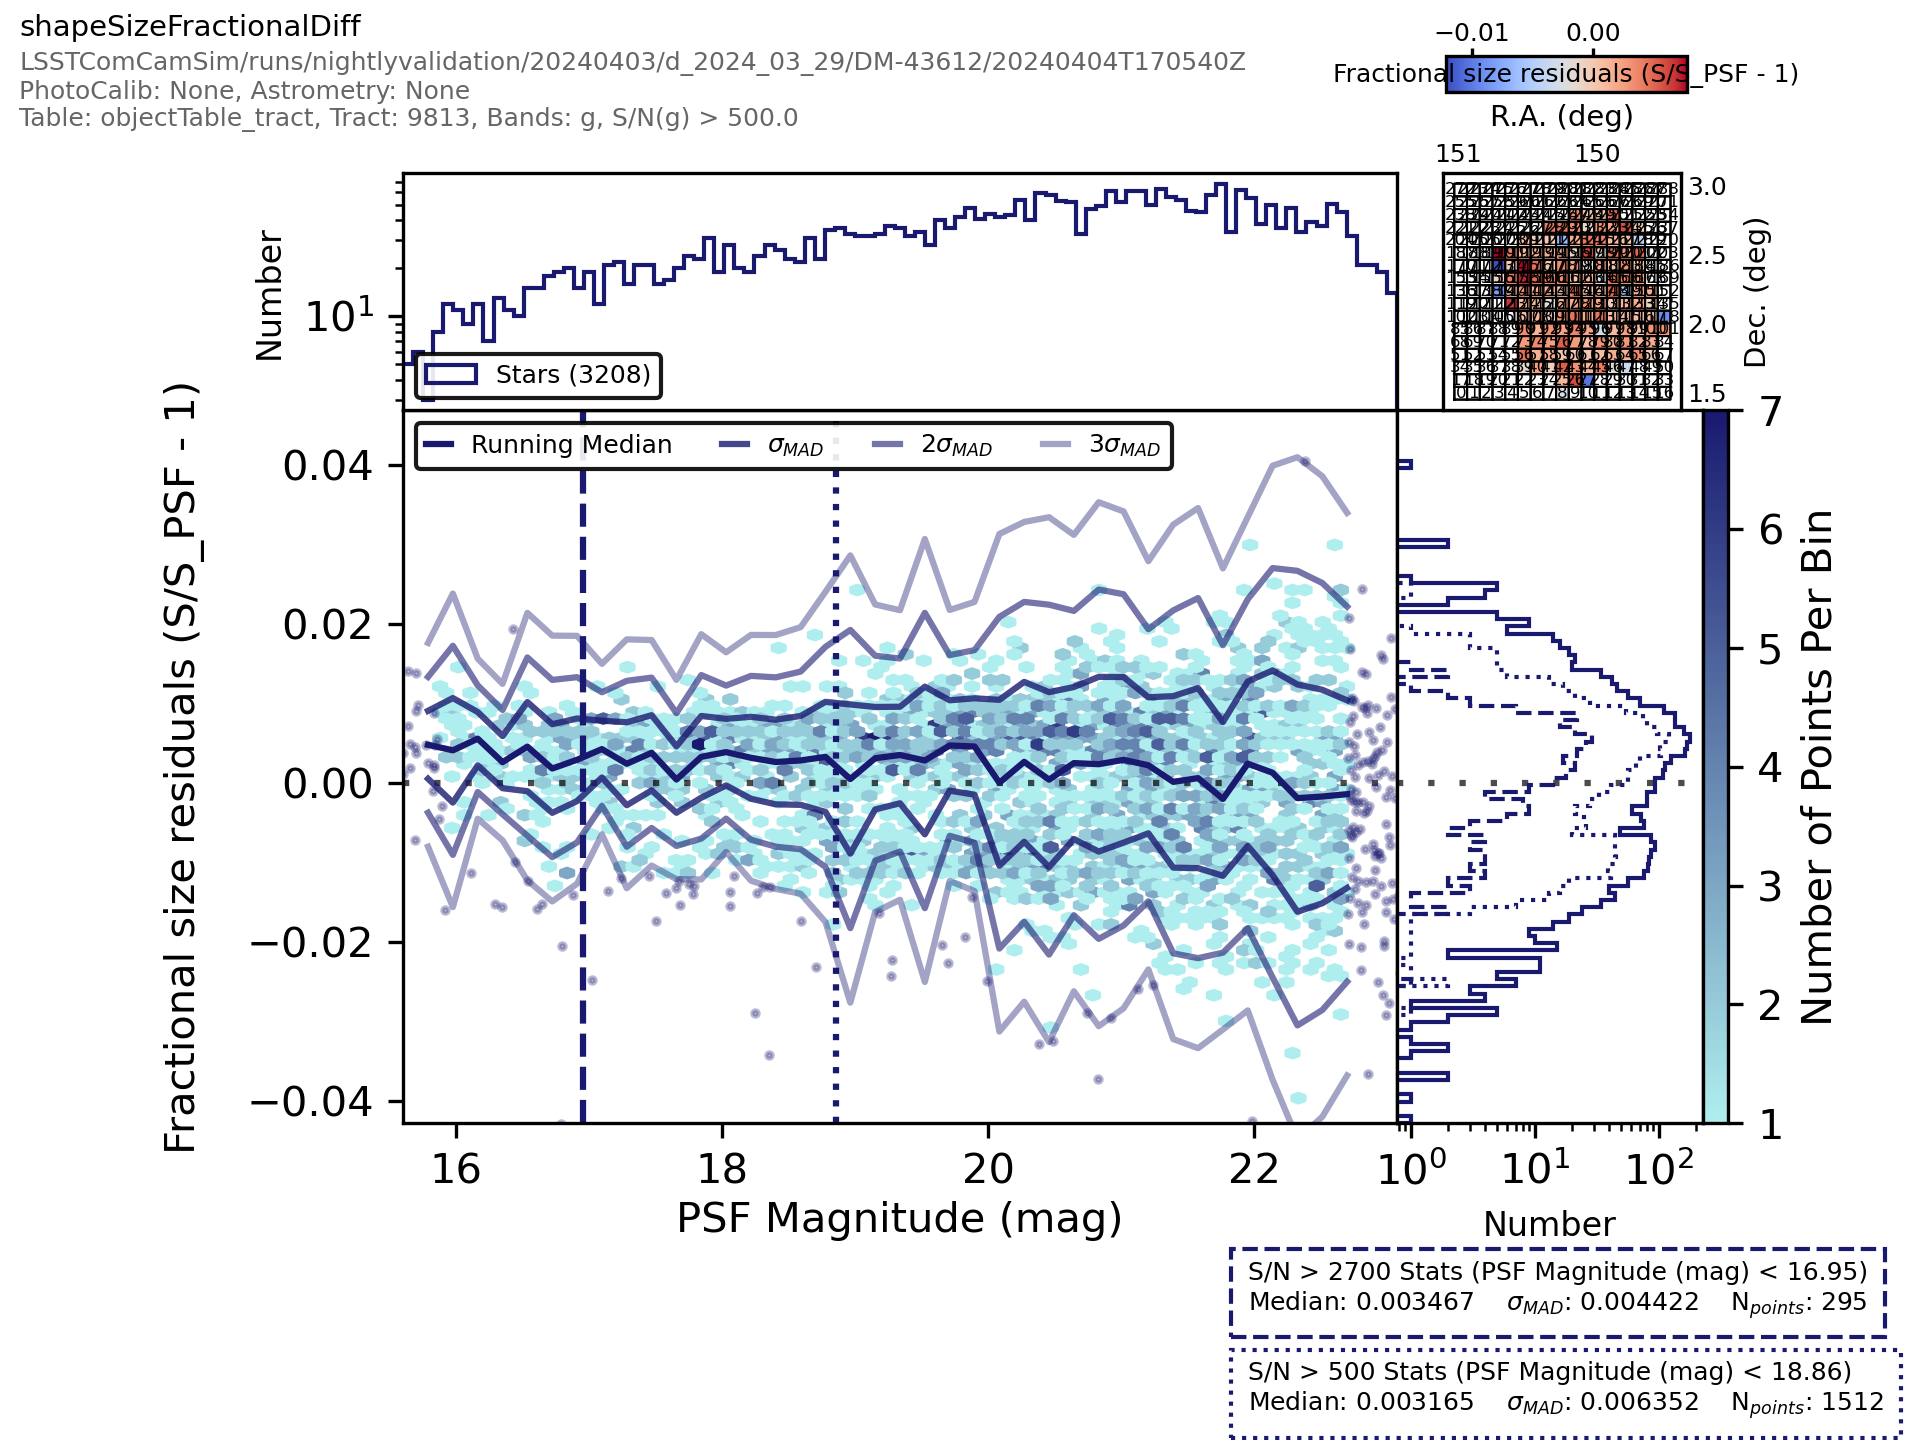
Fig. 20 Plot Name: objectTableCore_g_shapeSizeFractionalDiff_ScatterPlotWithTwoHists#
Associated metrics: objectTableCore_metrics
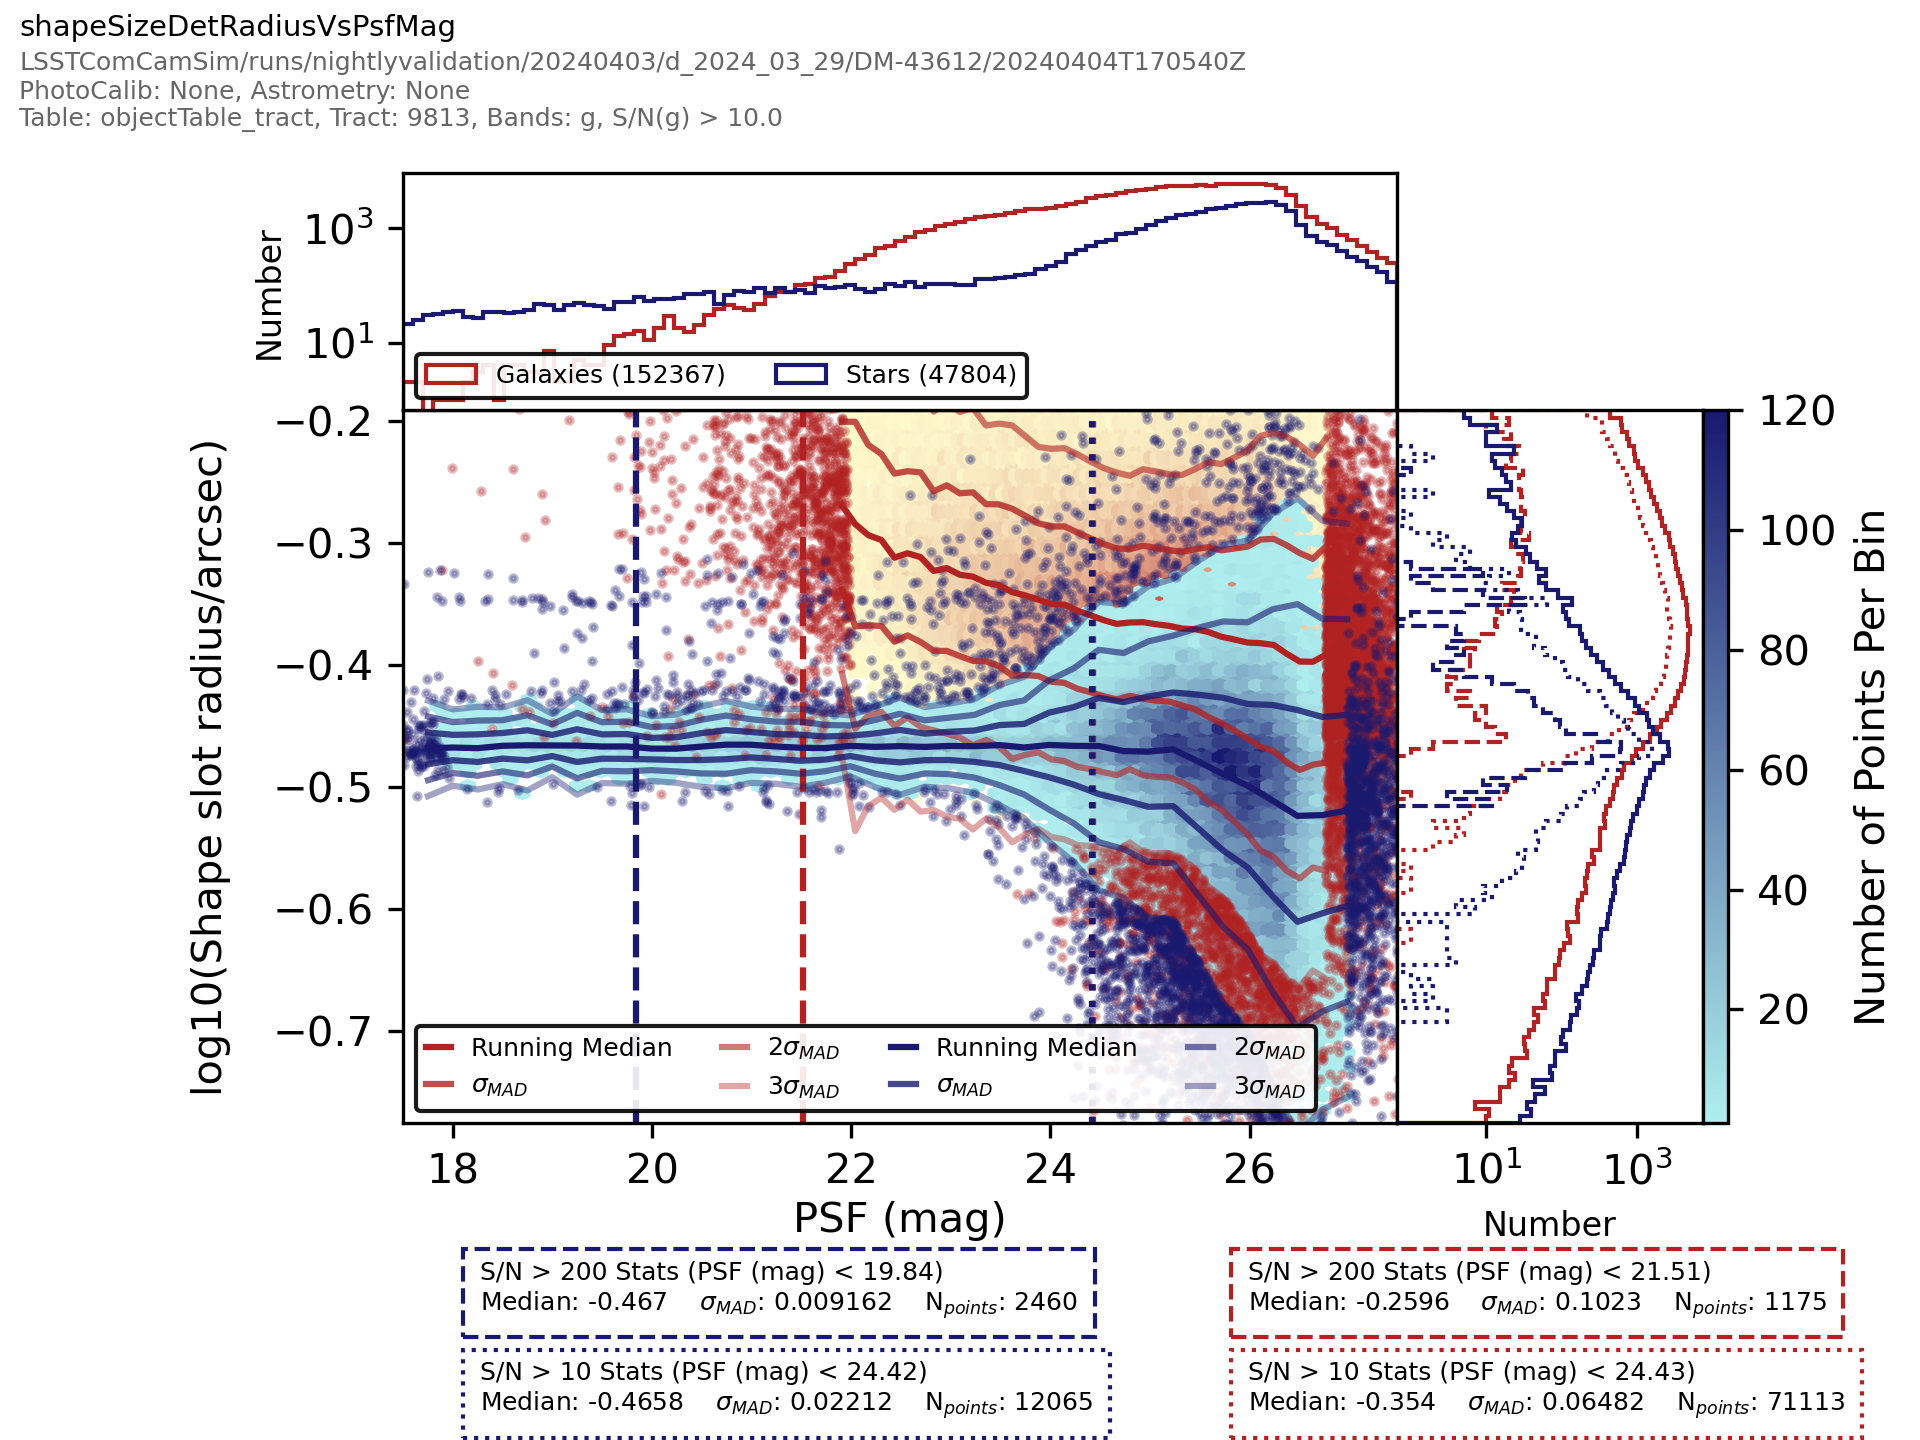
Fig. 21 Plot Name: objectTableCore_g_shapeSizeDetRadiusVsPsfMag_ScatterPlotWithTwoHists#
Associated metrics: objectTableCore_metrics
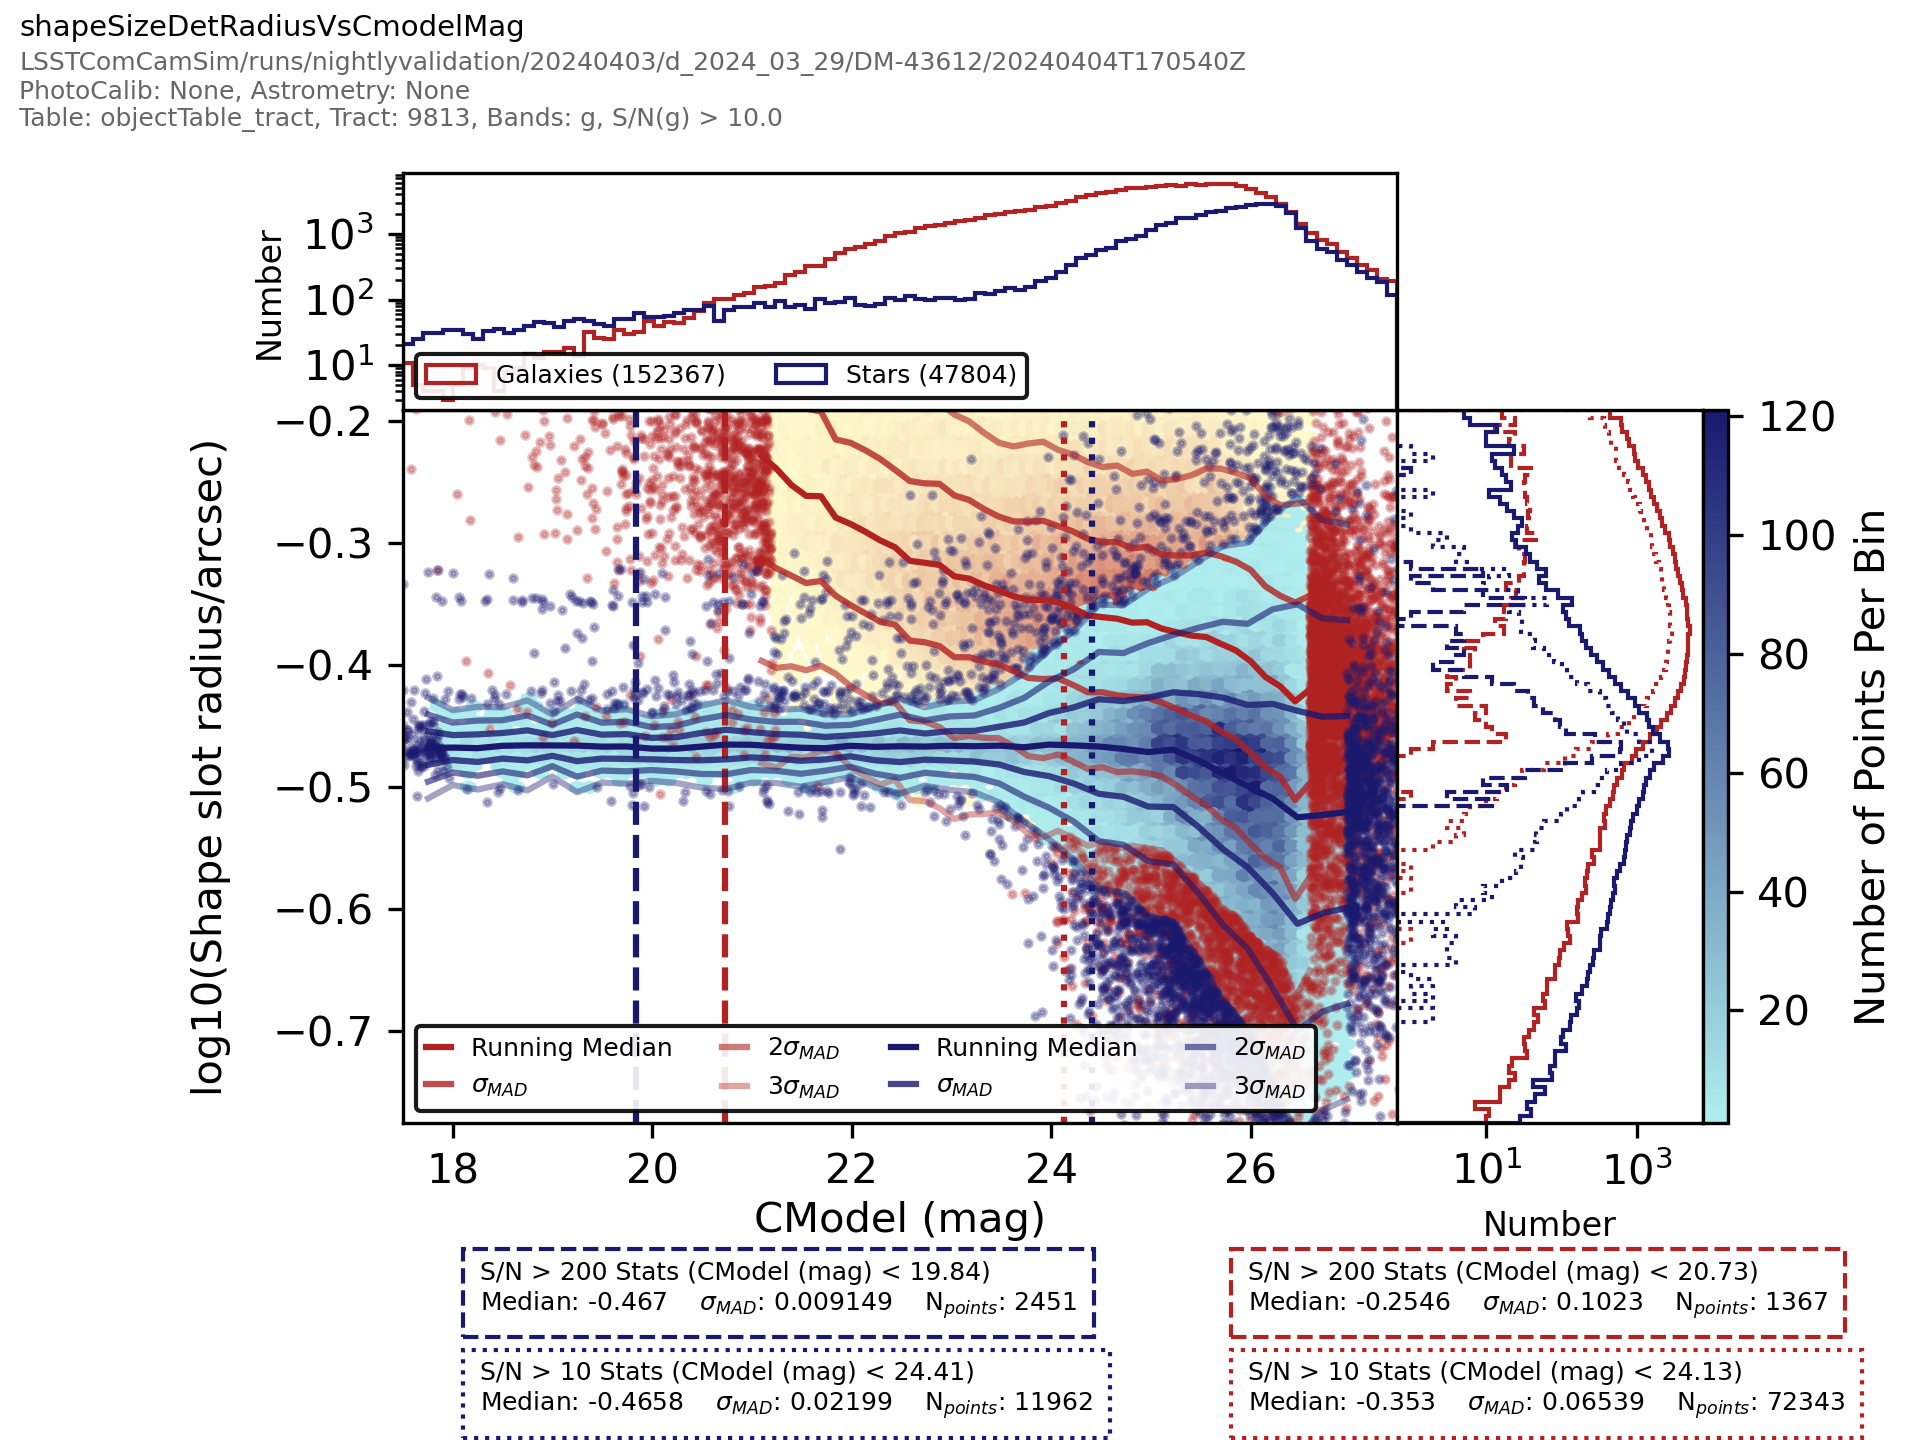
Fig. 22 Plot Name: objectTableCore_g_shapeSizeDetRadiusVsCmodelMag_ScatterPlotWithTwoHists#
Associated metrics: objectTableCore_metrics
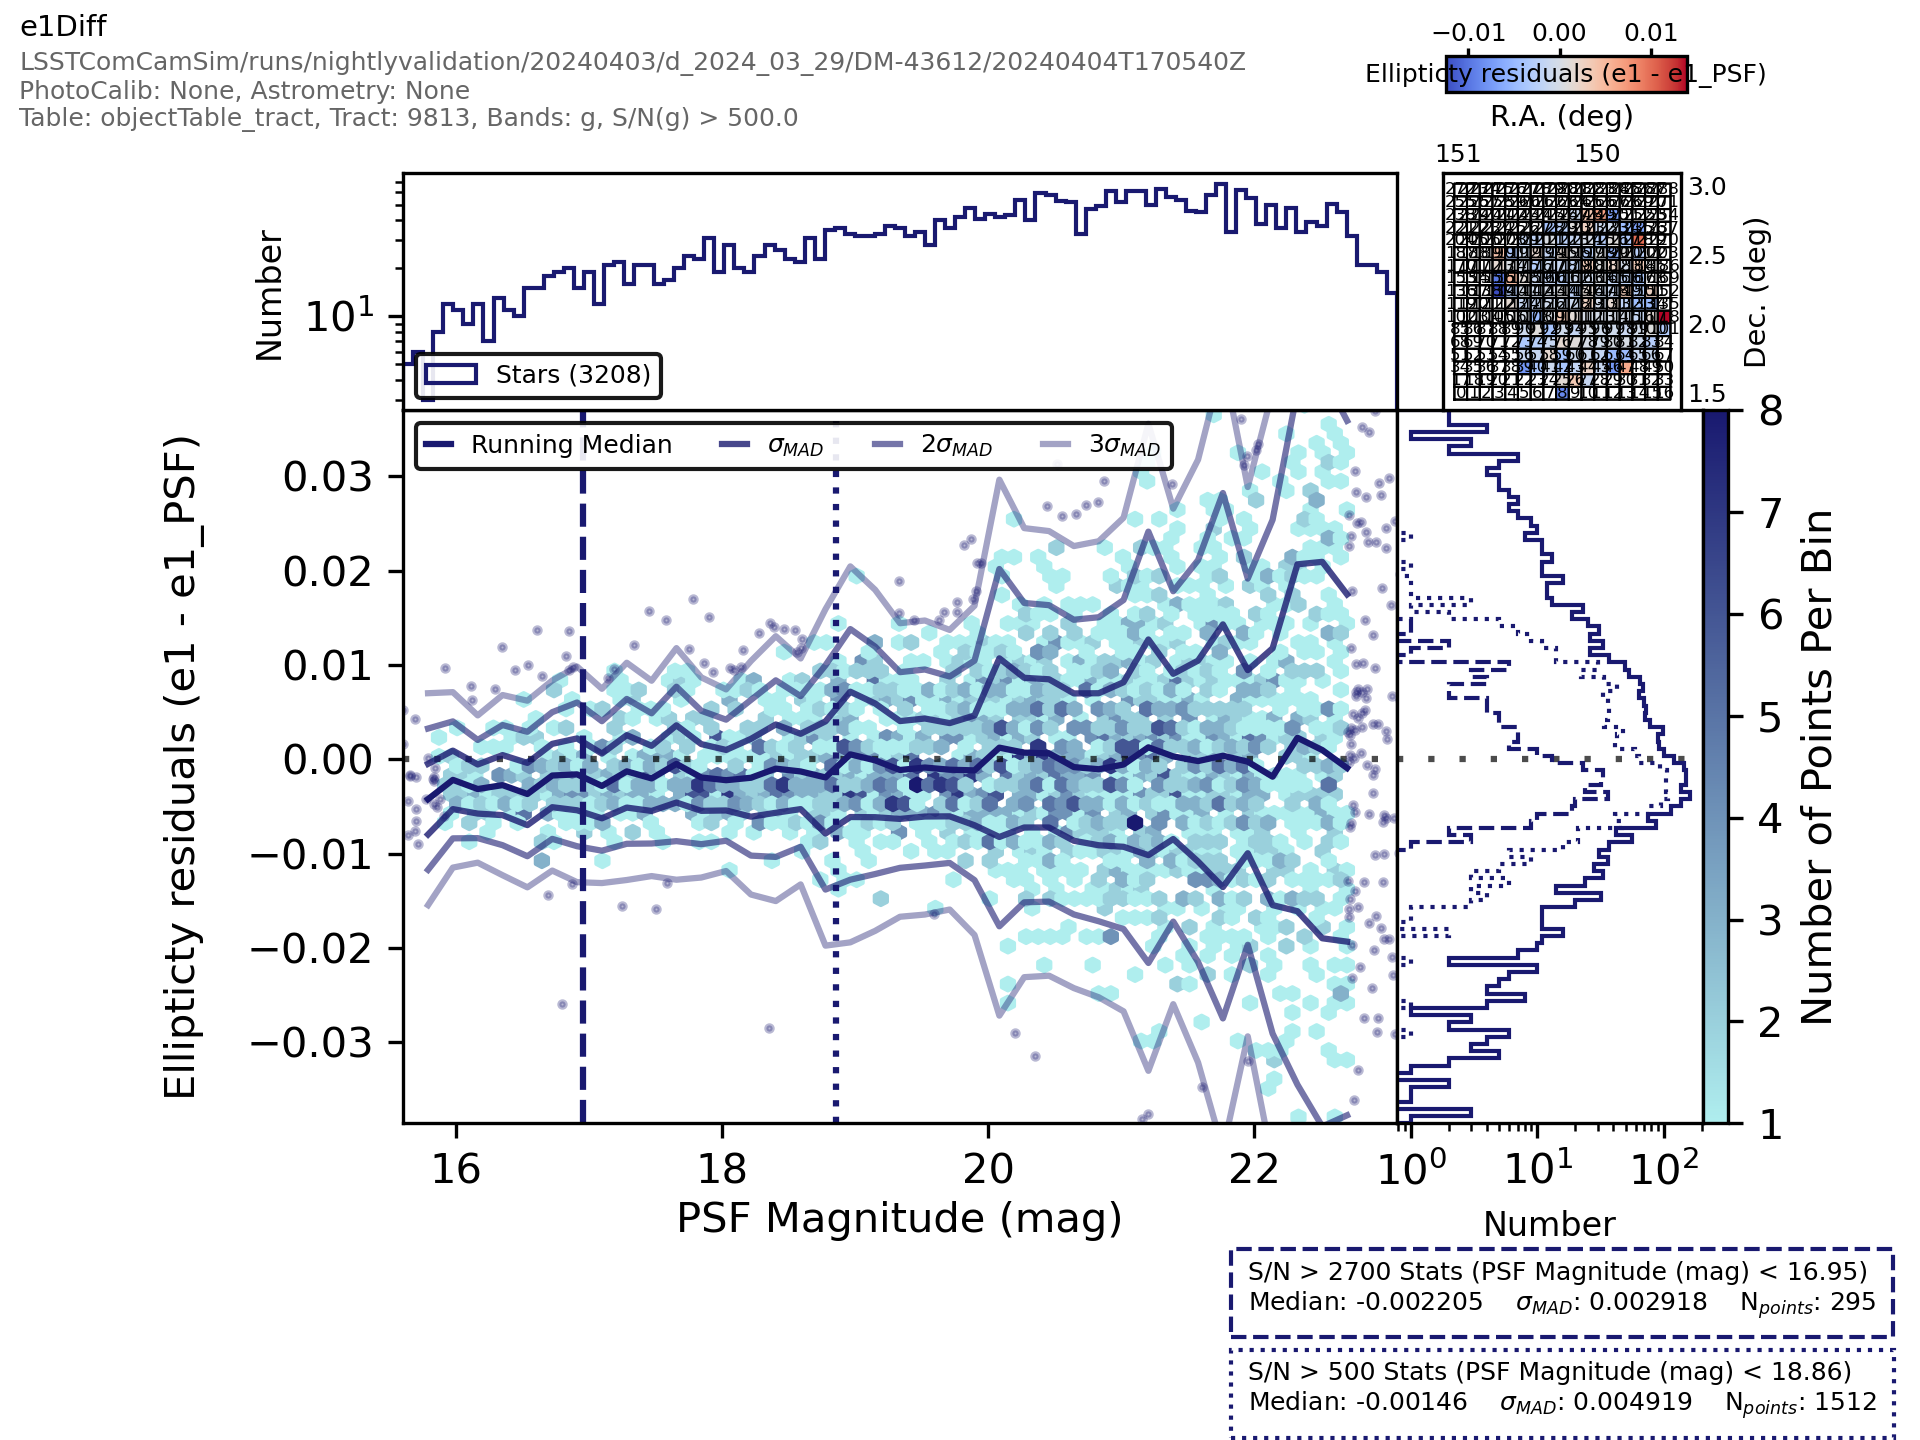
Fig. 23 Plot Name: objectTableCore_g_e1Diff_ScatterPlotWithTwoHists#
Associated metrics: objectTableCore_metrics
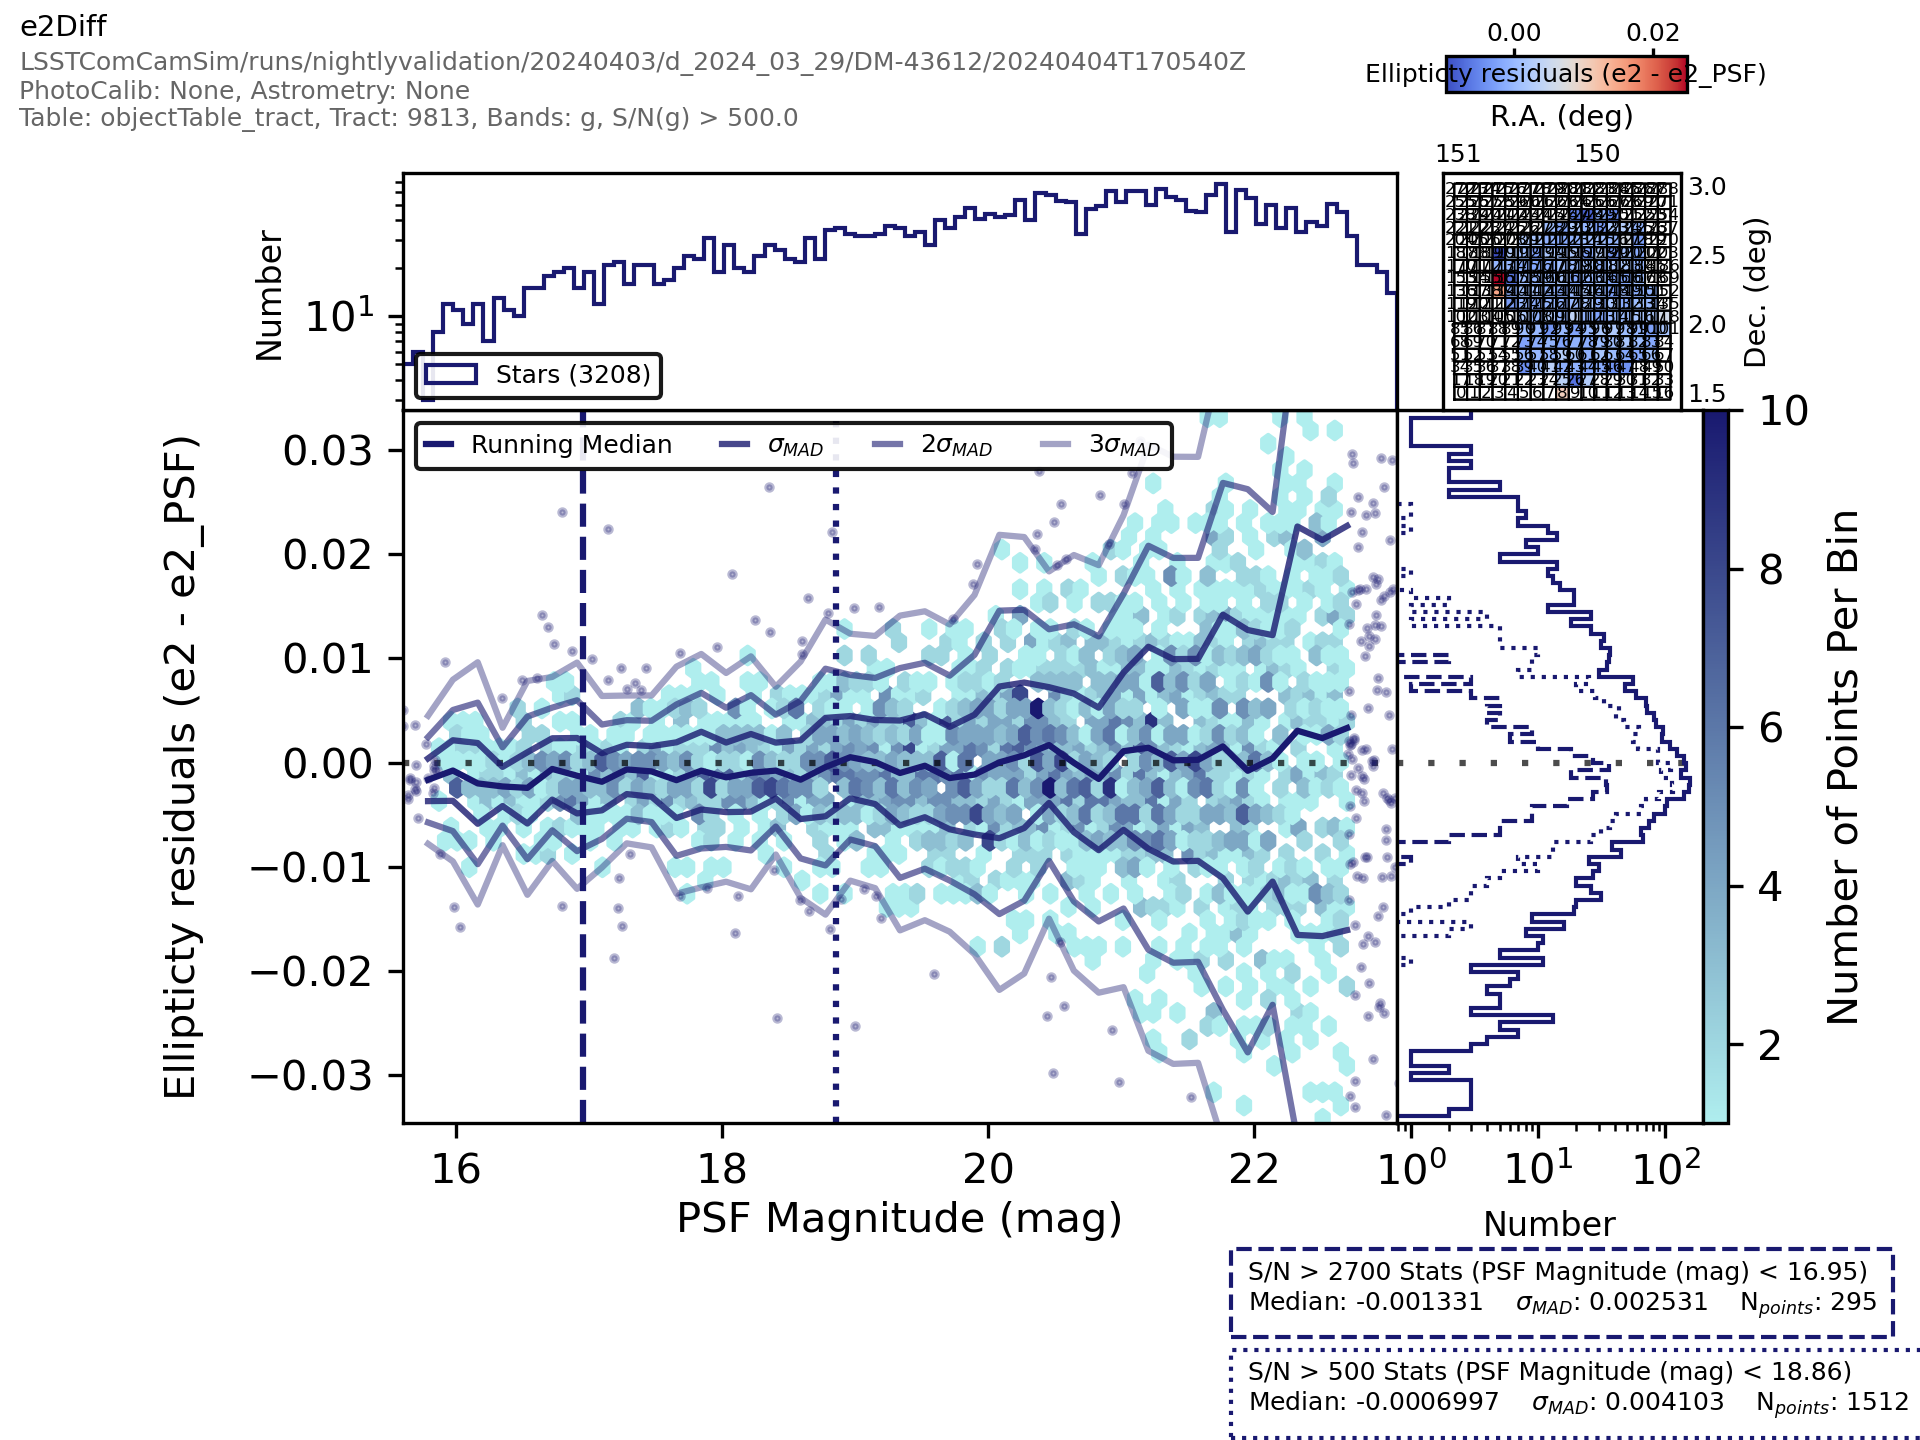
Fig. 24 Plot Name: objectTableCore_g_e2Diff_ScatterPlotWithTwoHists#
Associated metrics: objectTableCore_metrics
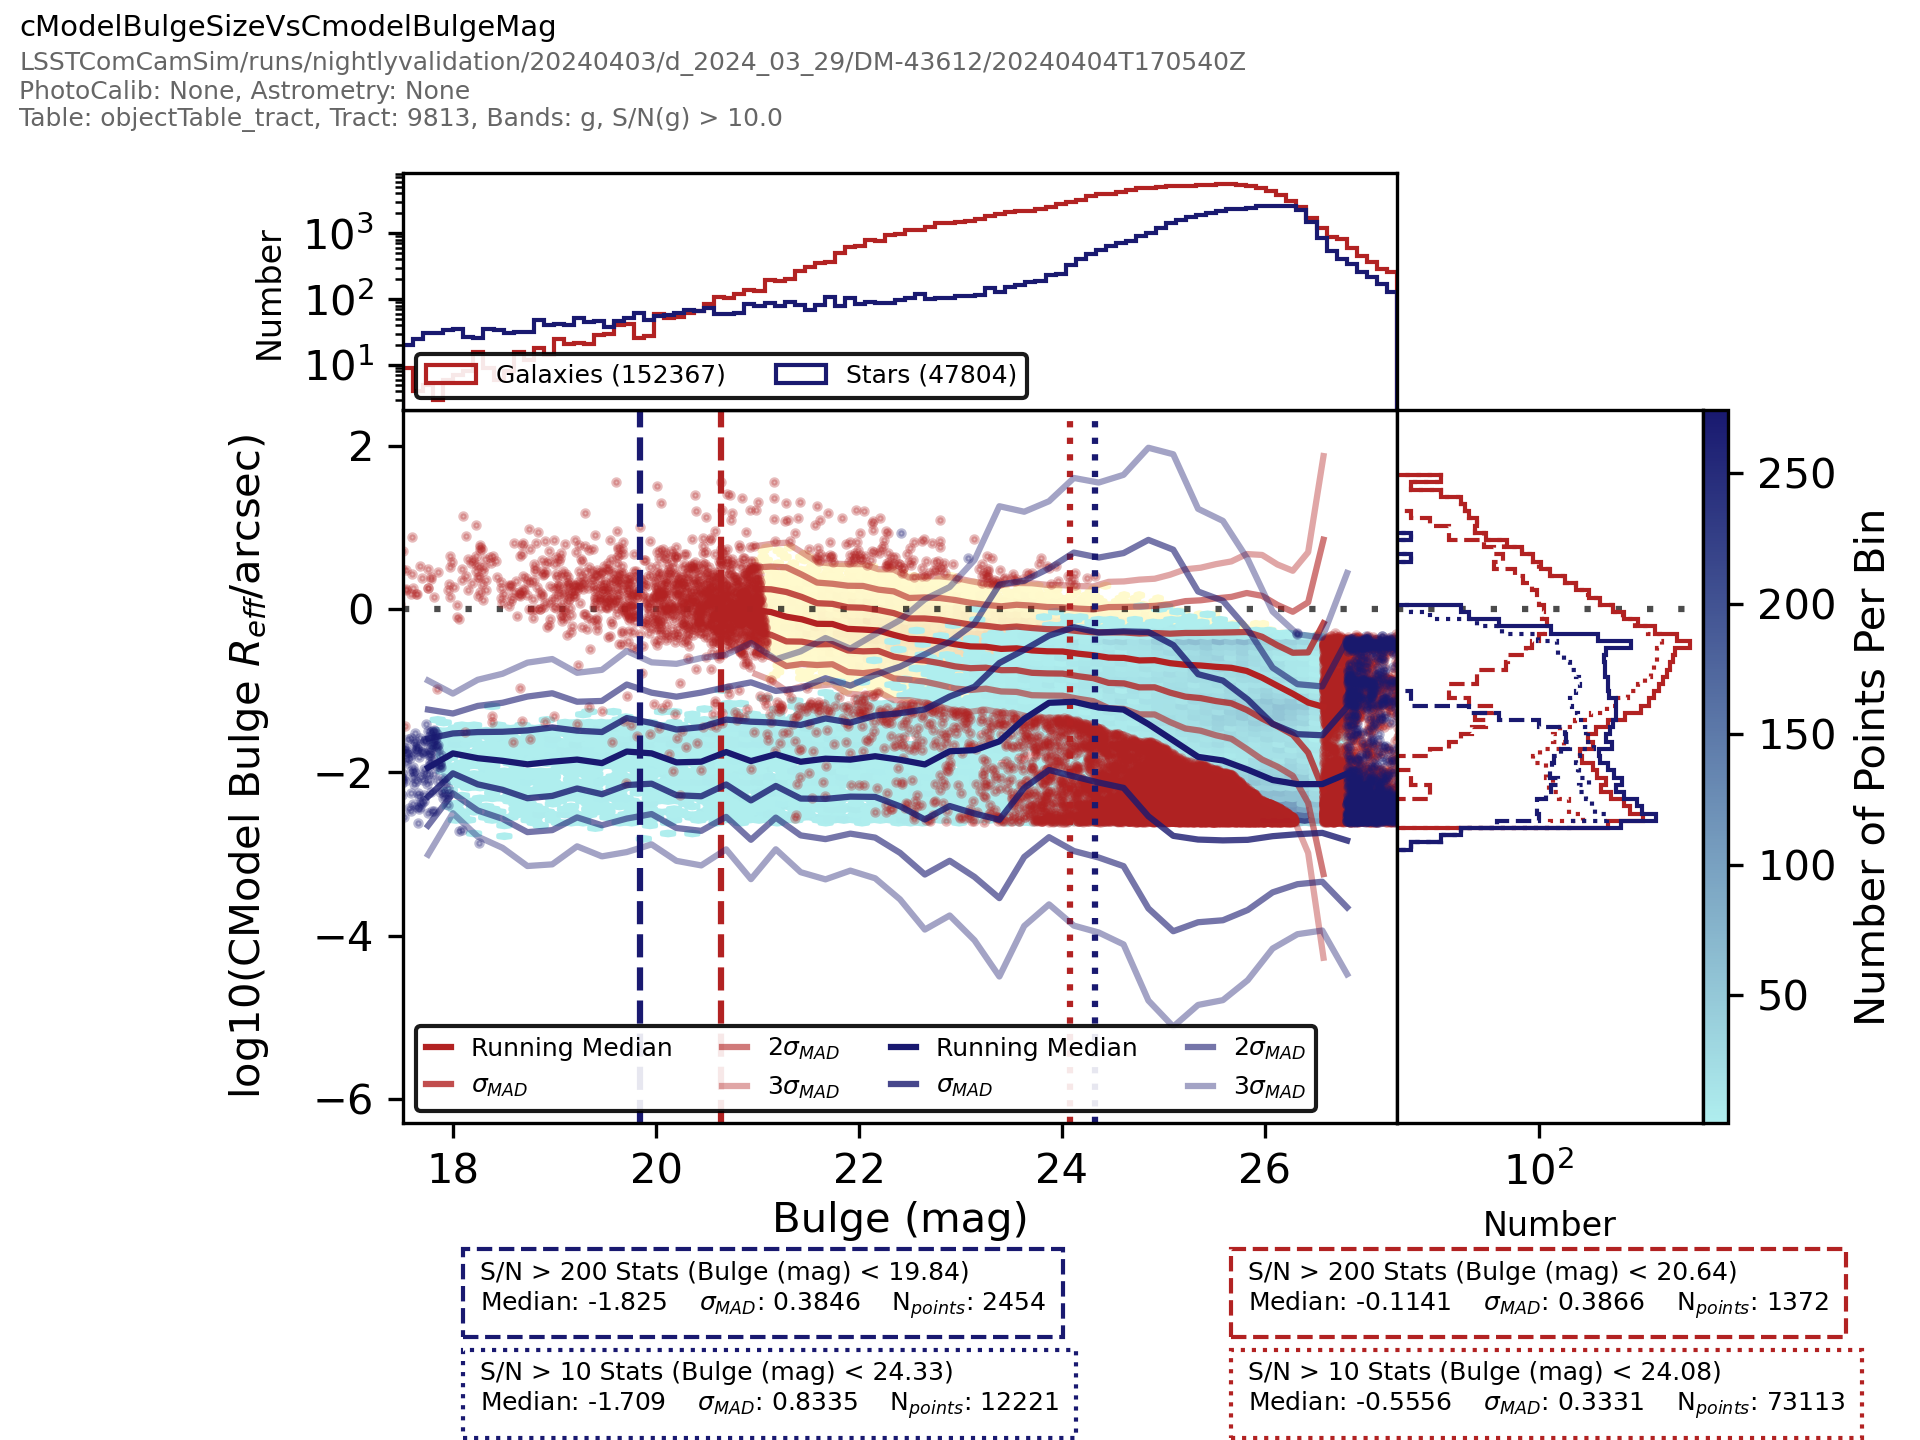
Fig. 25 Plot Name: objectTableCore_g_cModelBulgeSizeVsCmodelBulgeMag_ScatterPlotWithTwoHists#
Associated metrics: objectTableCore_metrics
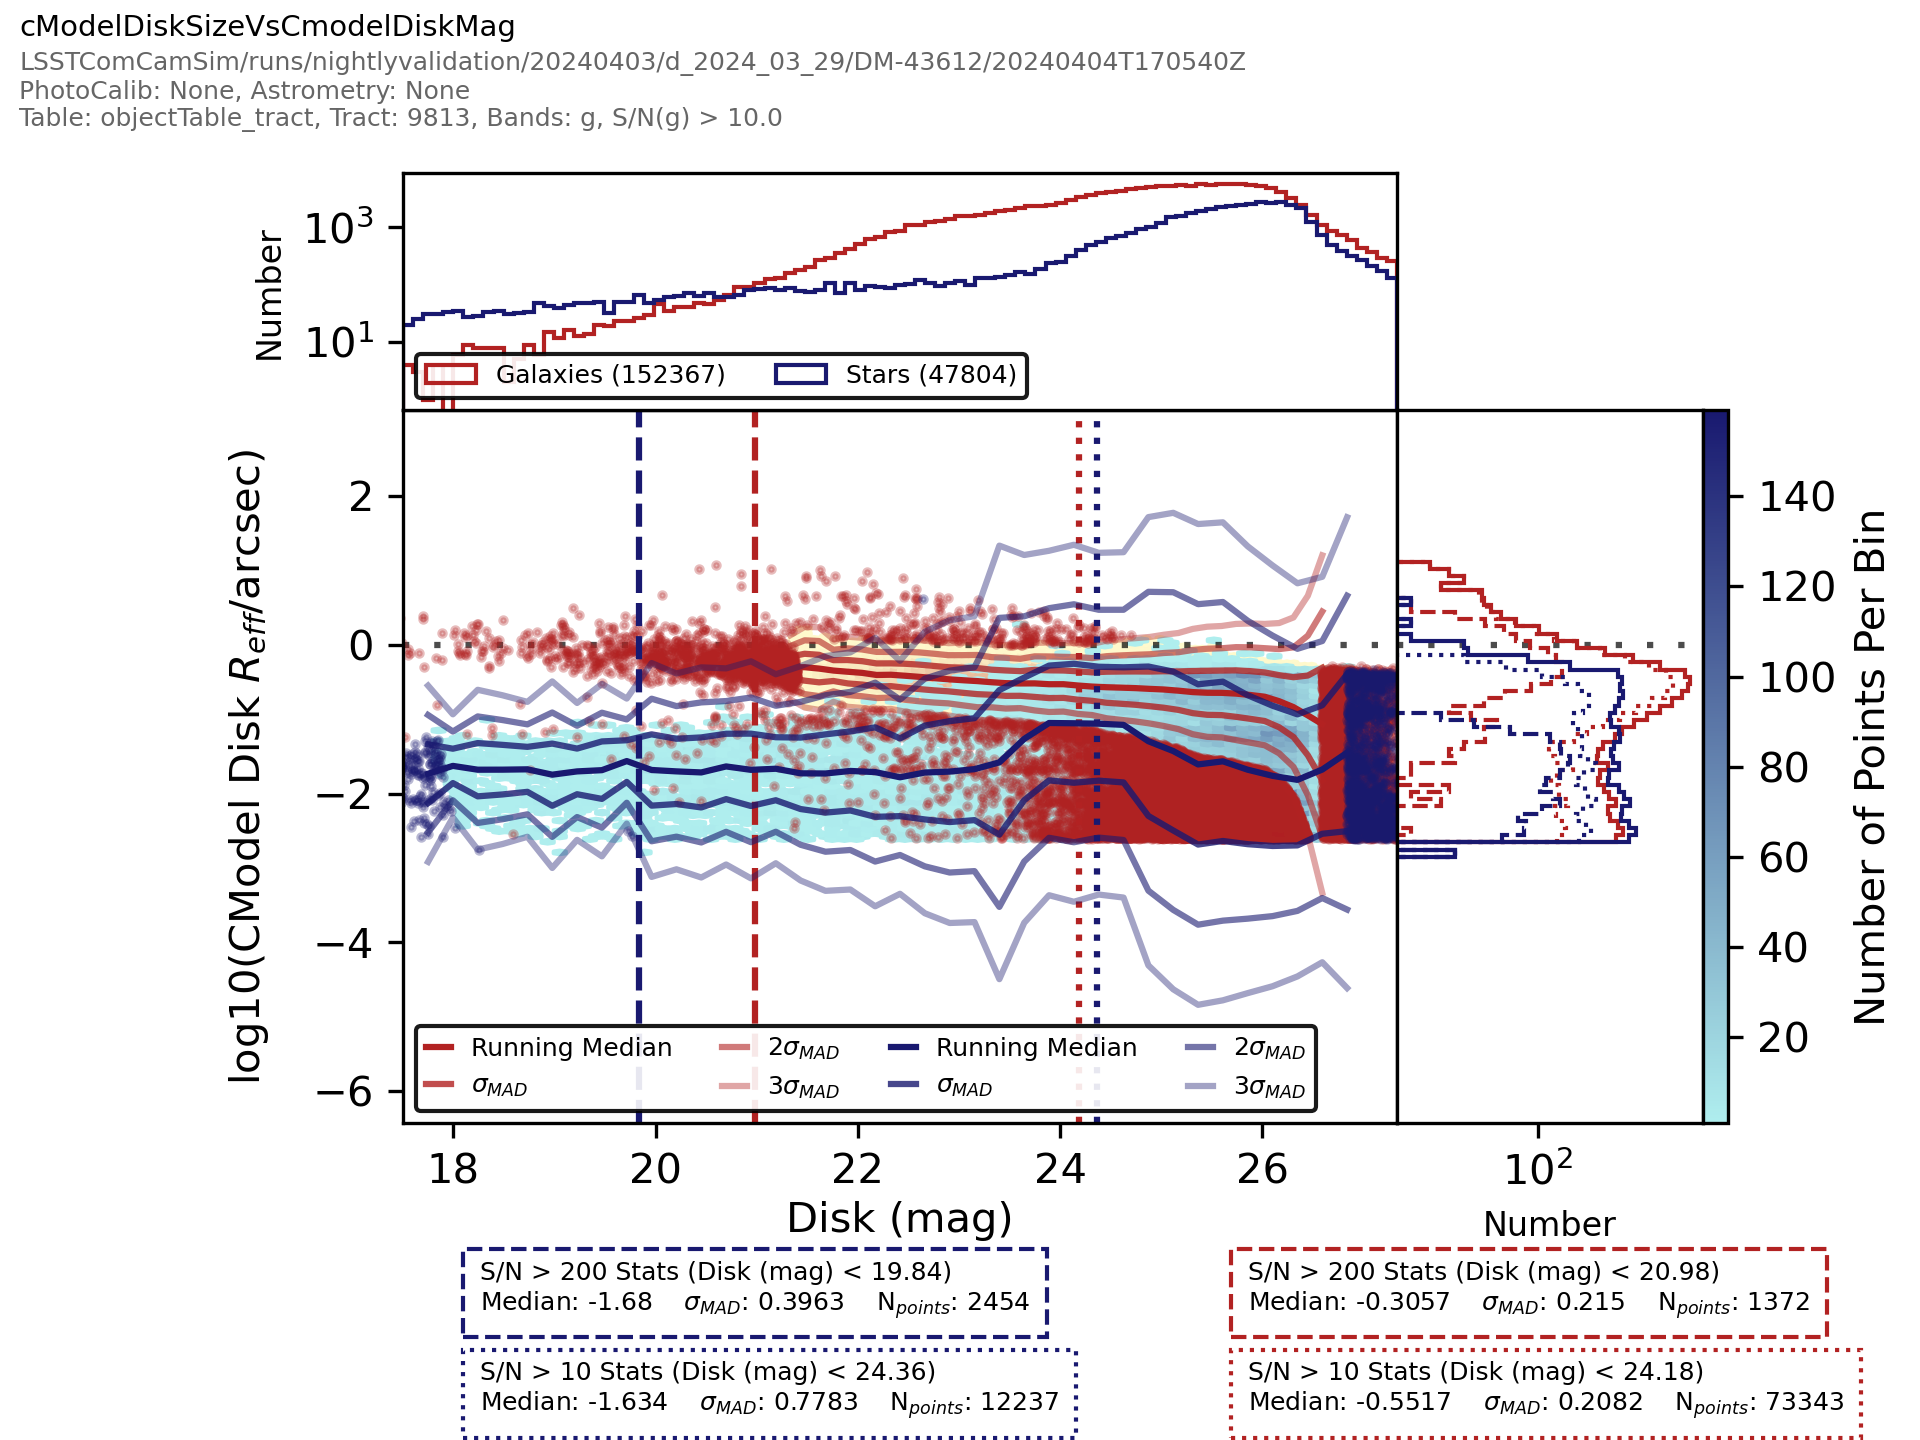
Fig. 26 Plot Name: objectTableCore_g_cModelDiskSizeVsCmodelDiskMag_ScatterPlotWithTwoHists#
Associated metrics: objectTableCore_metrics
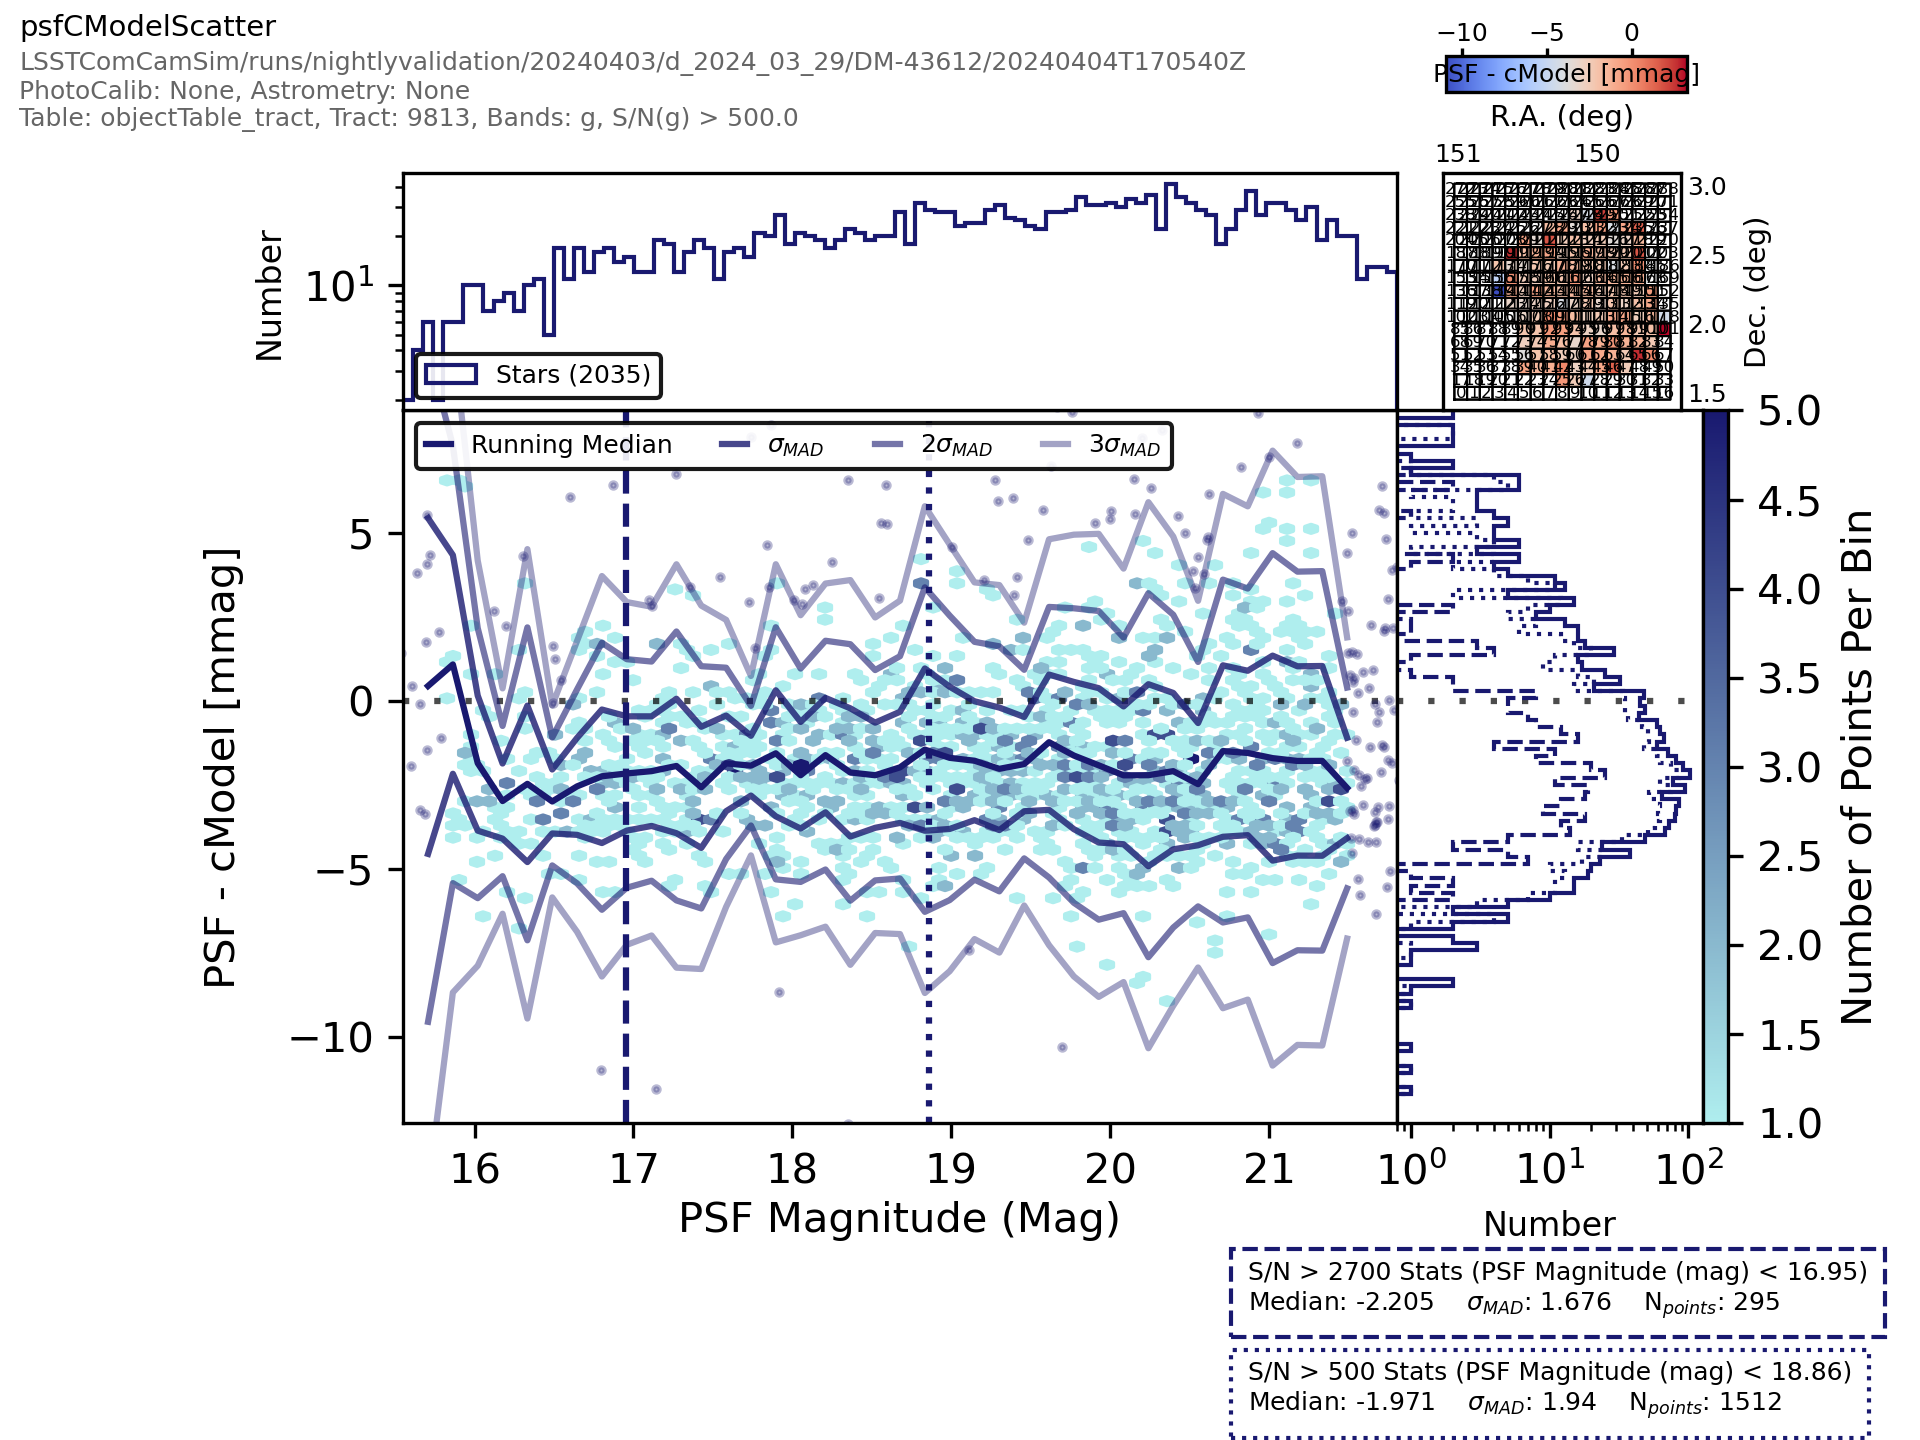
Fig. 27 Plot Name: objectTableCore_g_psfCModelScatter_ScatterPlotWithTwoHists#
Associated metrics: objectTableCore_metrics
objectTableExtended#
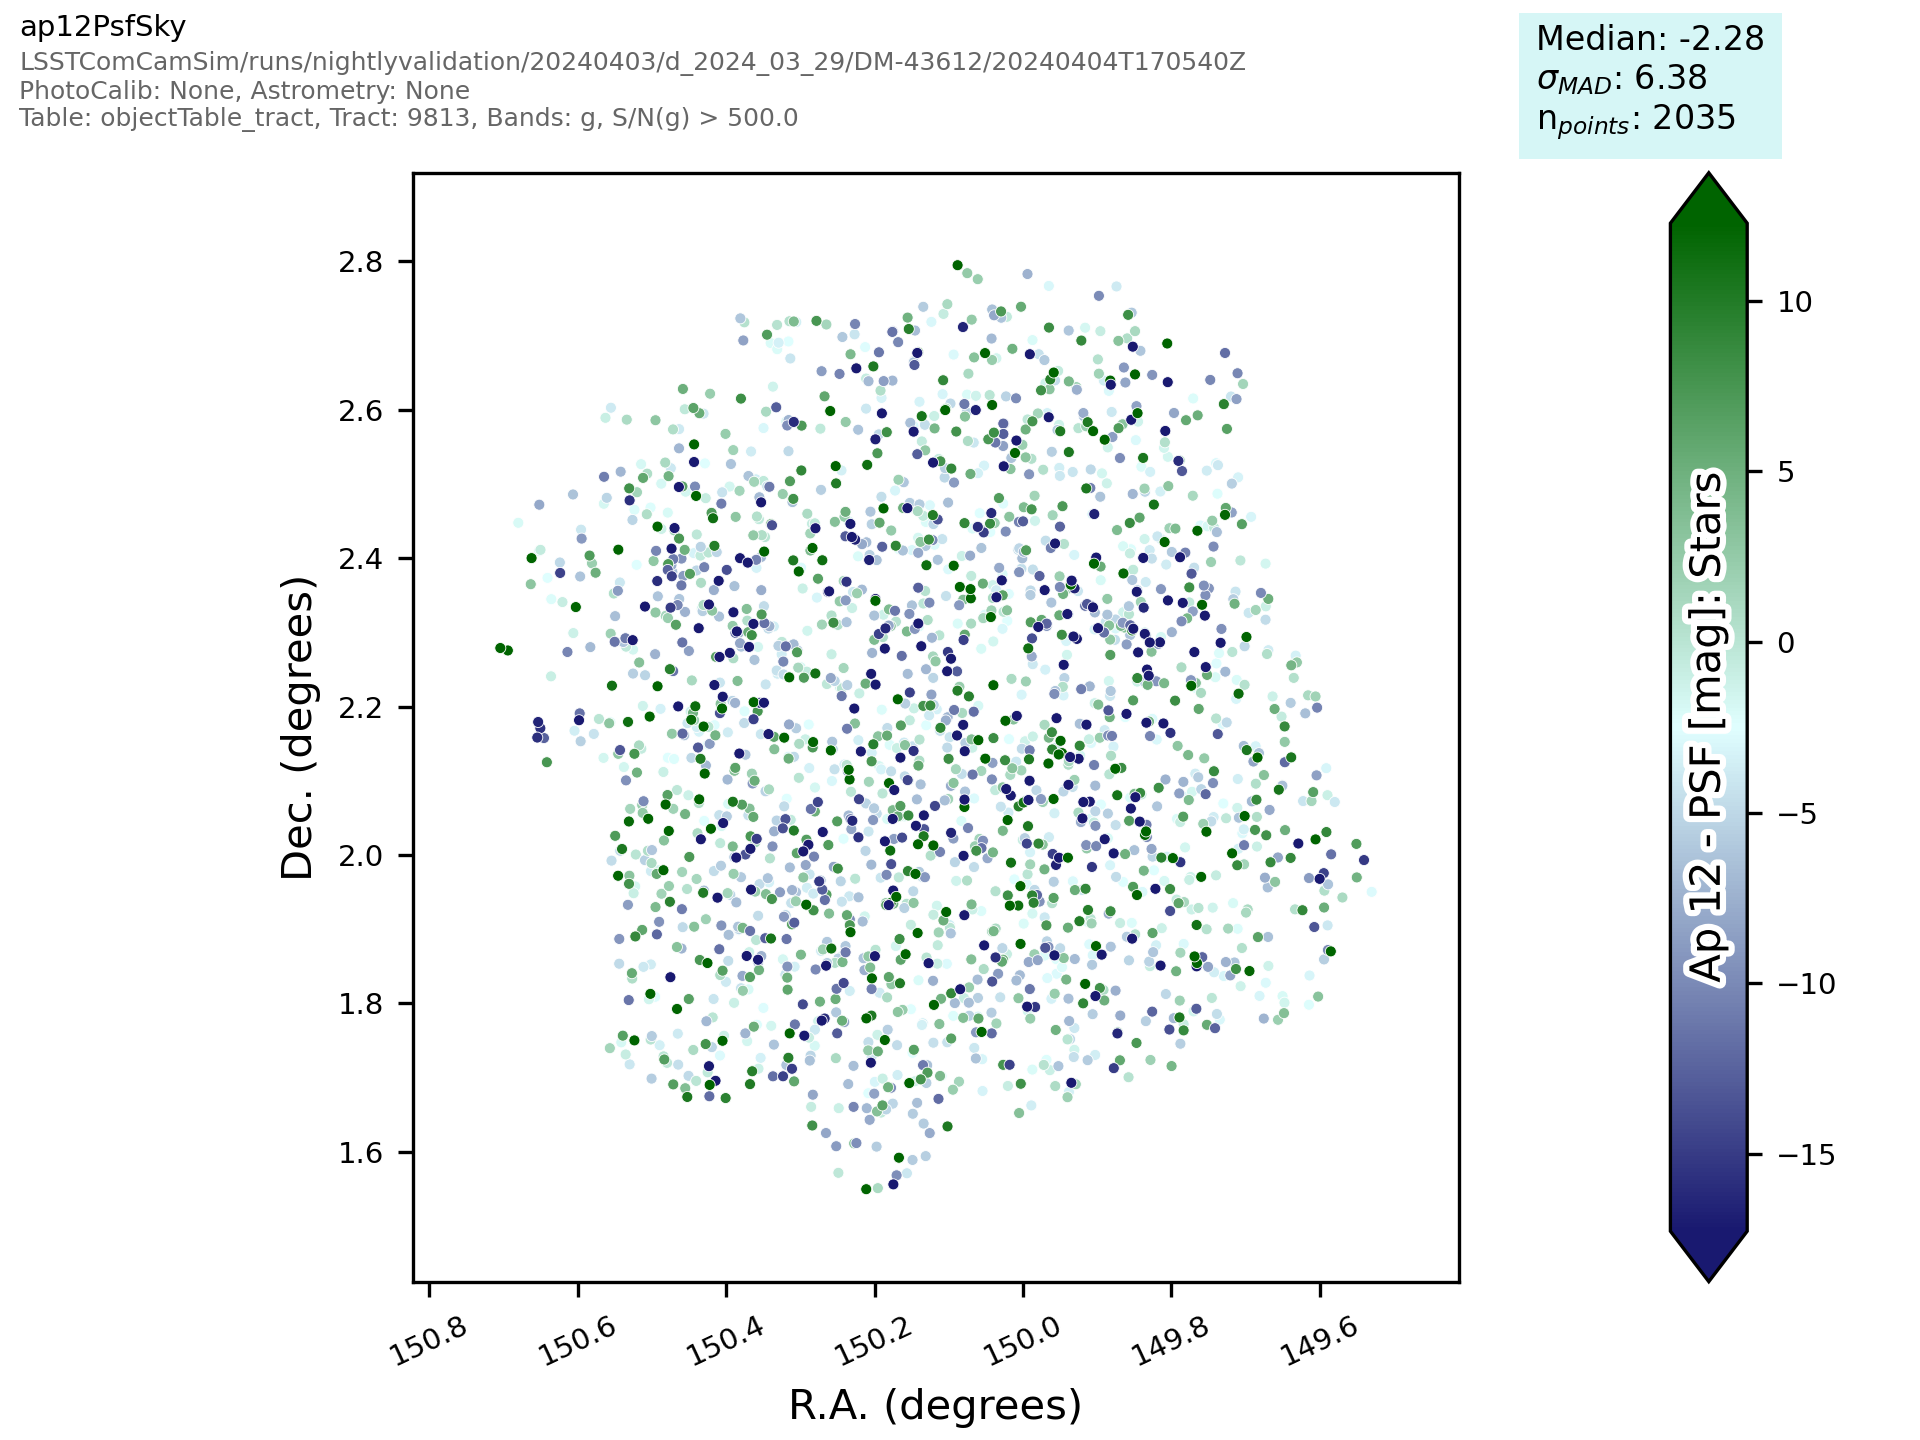
Fig. 28 Plot Name: objectTableExtended_g_ap12PsfSky_SkyPlot#
Associated metrics: objectTableExtended_metrics
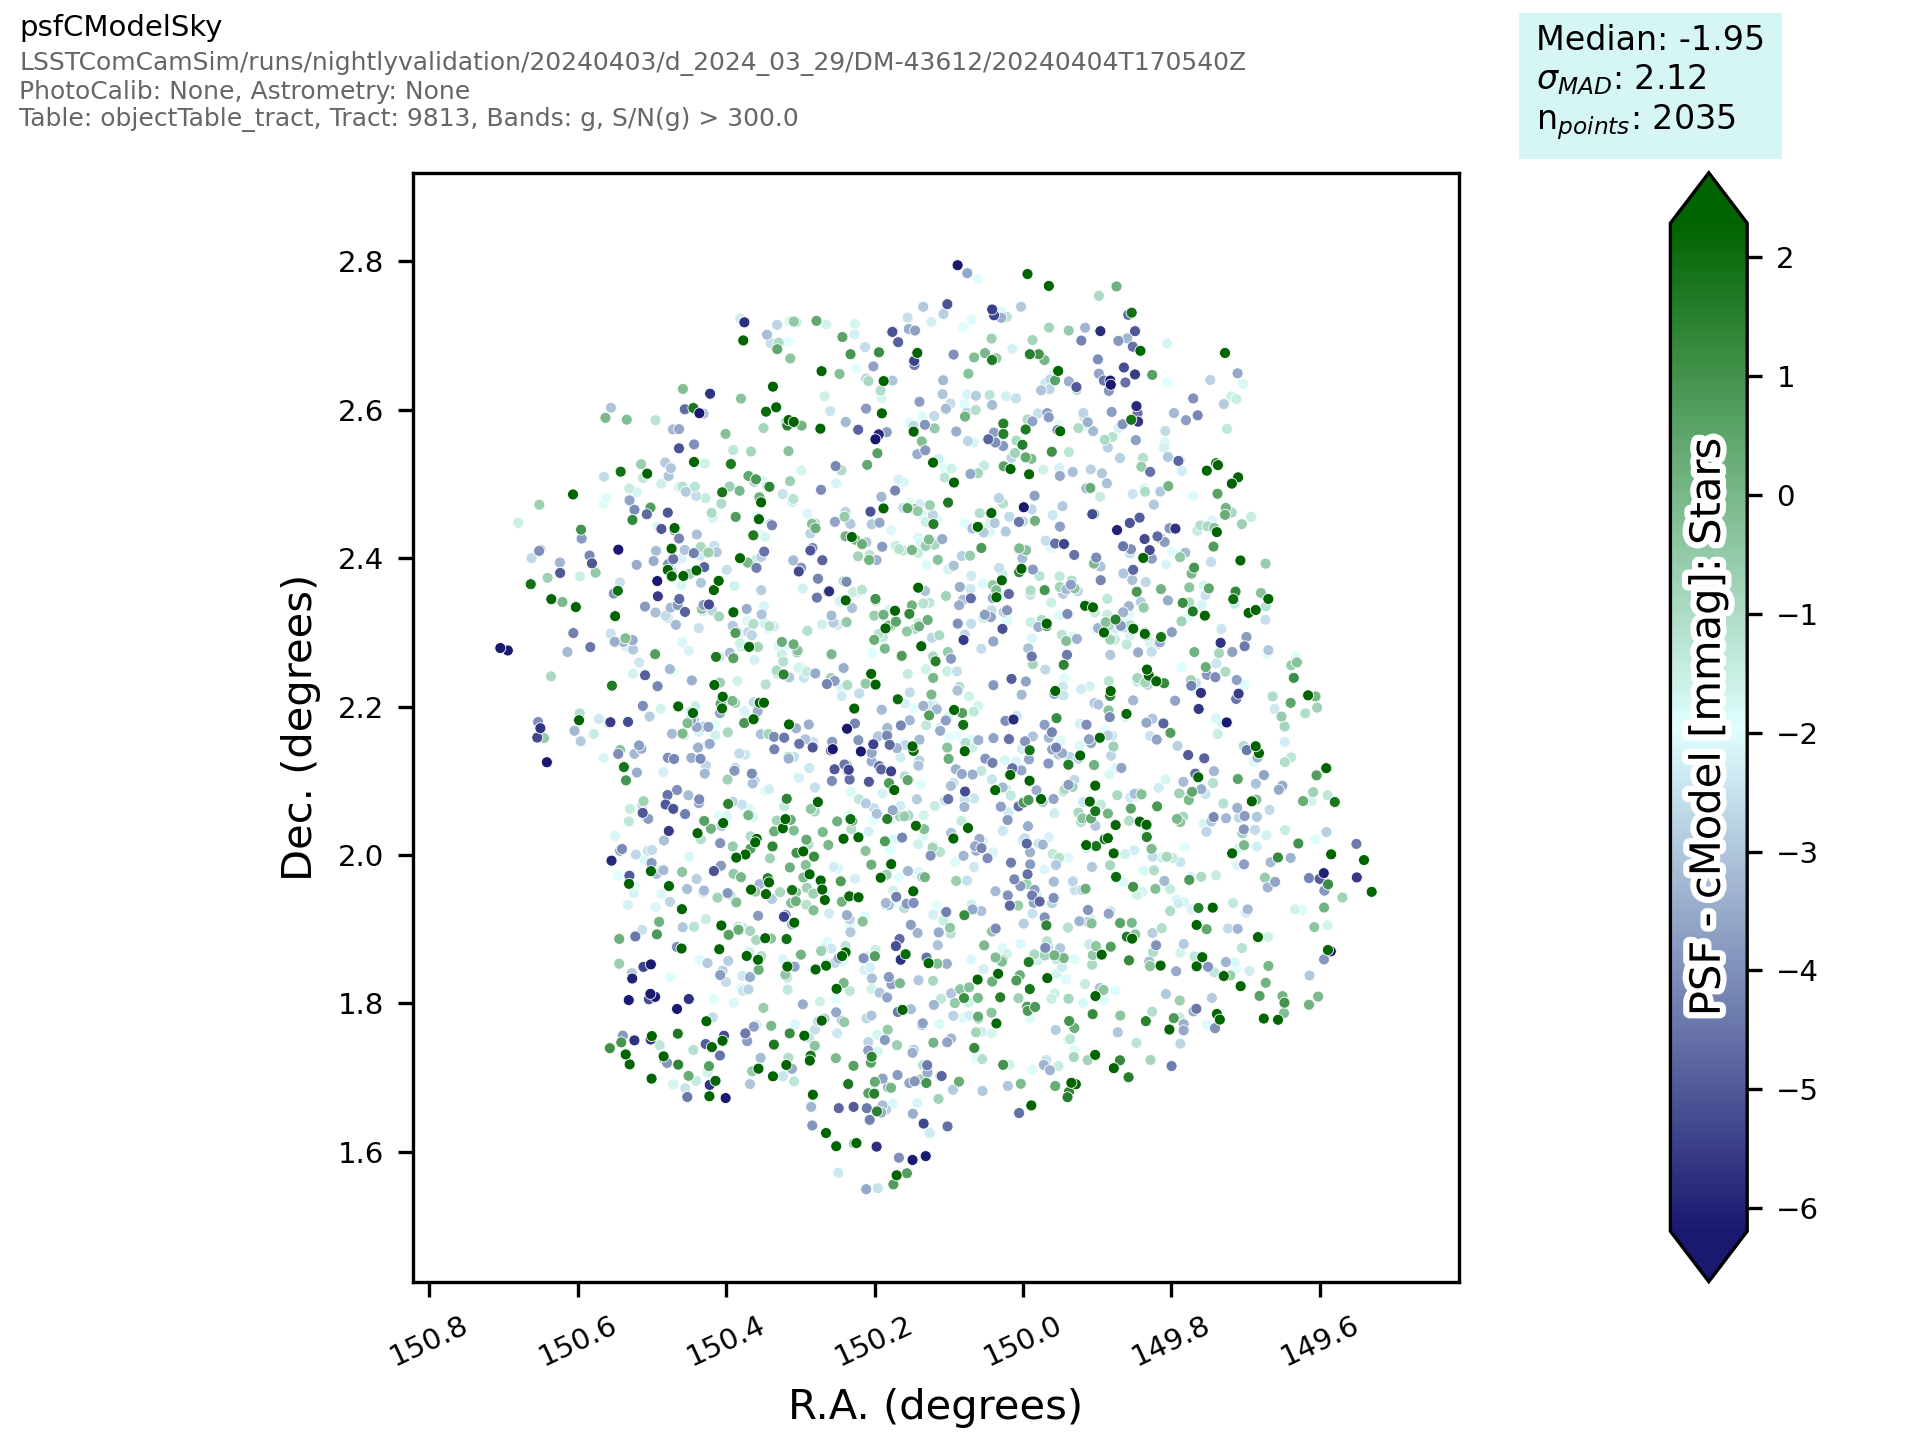
Fig. 29 Plot Name: objectTableExtended_g_psfCModelSky_SkyPlot#
Associated metrics: objectTableExtended_metrics
PropertyMapTract#
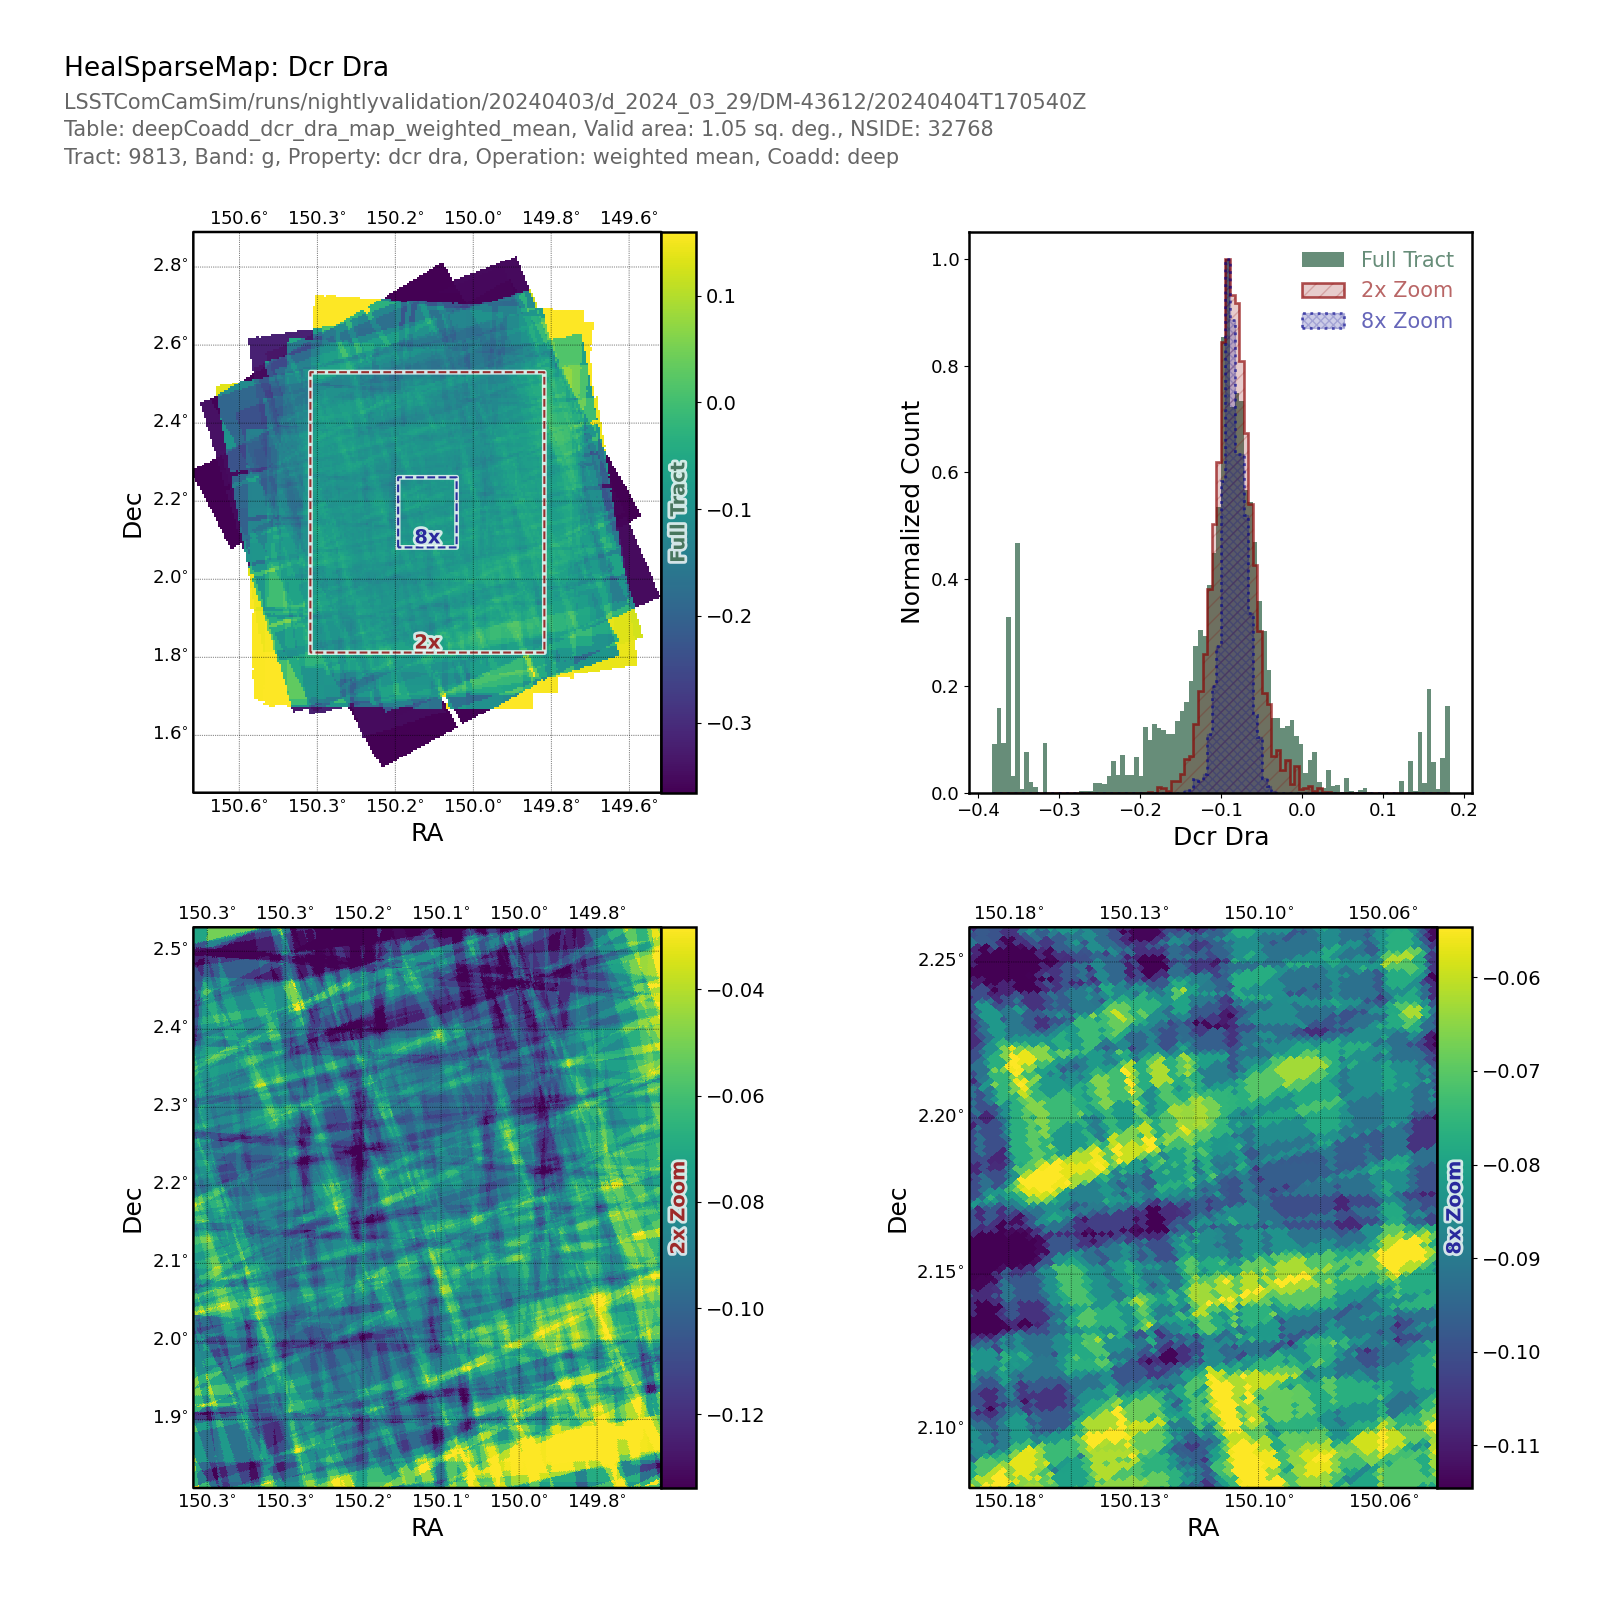
Fig. 30 Plot Name: propertyMapTract_HealSparseMap_deepCoadd_dcr_dra_weighted_mean_PropertyMapPlot#
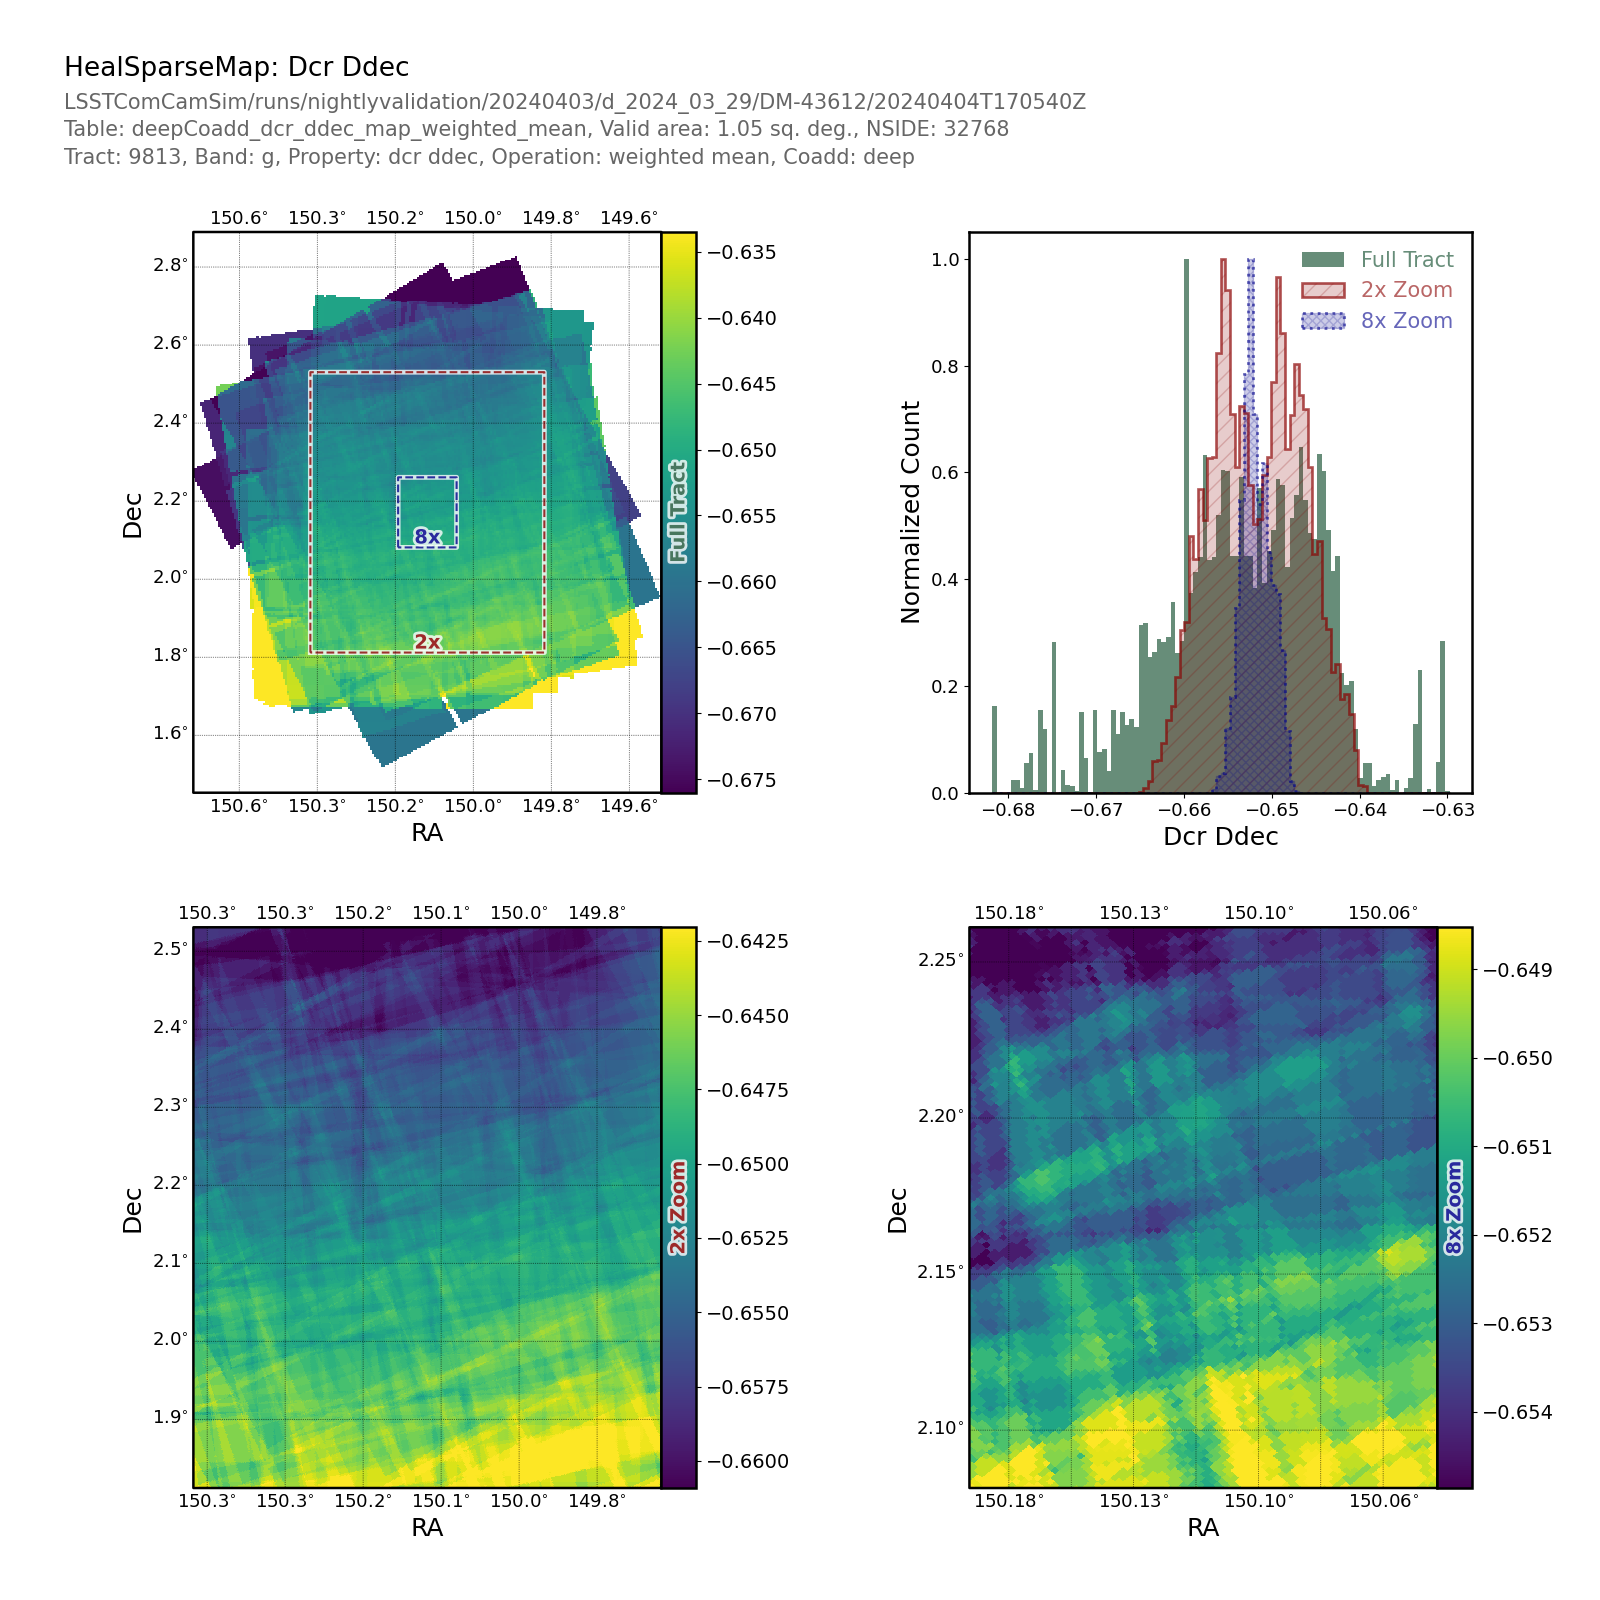
Fig. 31 Plot Name: propertyMapTract_HealSparseMap_deepCoadd_dcr_ddec_weighted_mean_PropertyMapPlot#
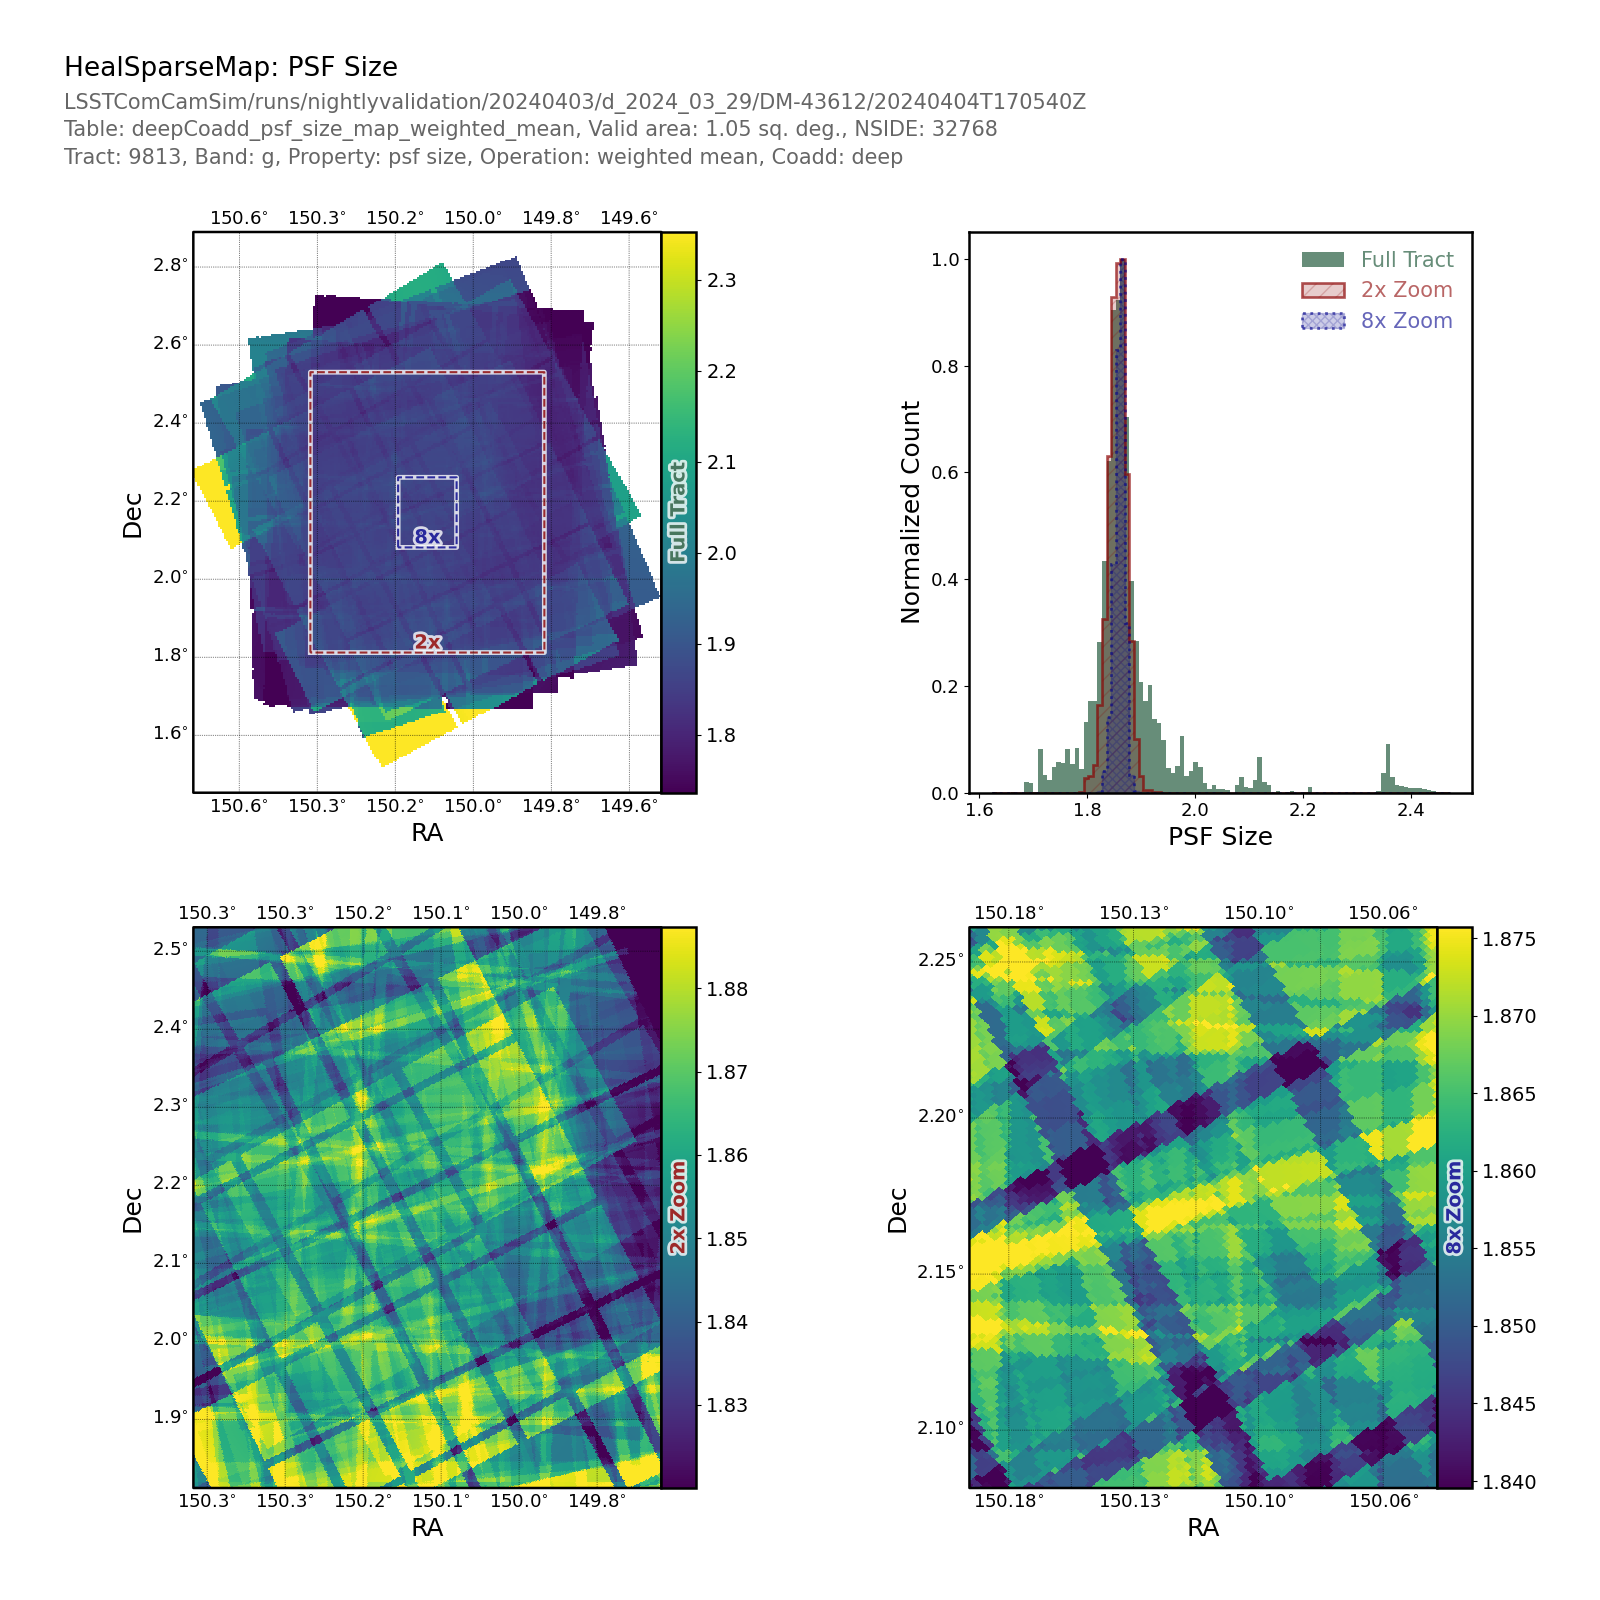
Fig. 32 Plot Name: propertyMapTract_HealSparseMap_deepCoadd_psf_size_weighted_mean_PropertyMapPlot#
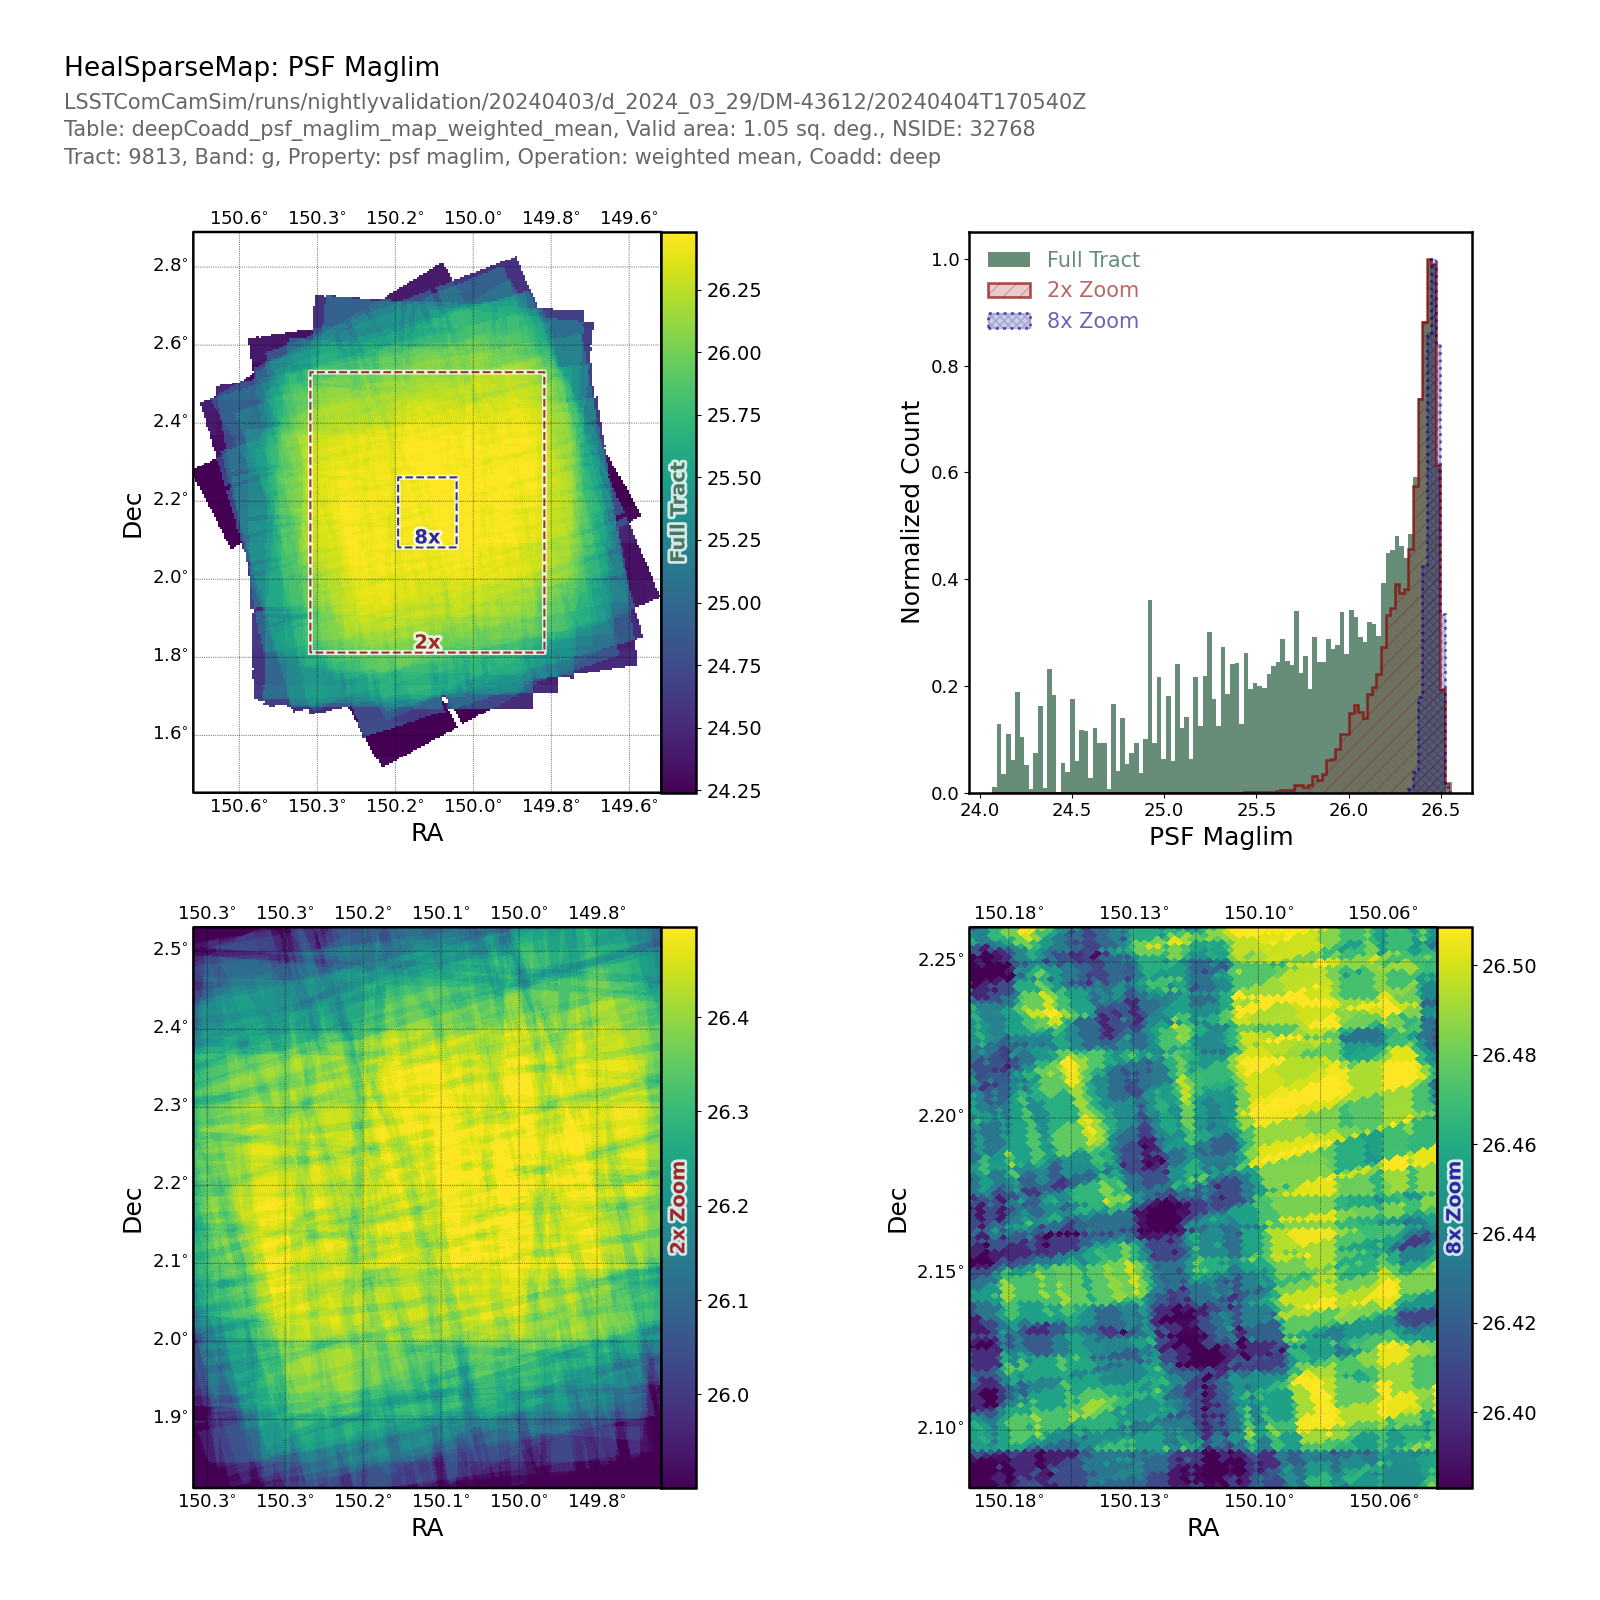
Fig. 33 Plot Name: propertyMapTract_HealSparseMap_deepCoadd_psf_maglim_weighted_mean_PropertyMapPlot#
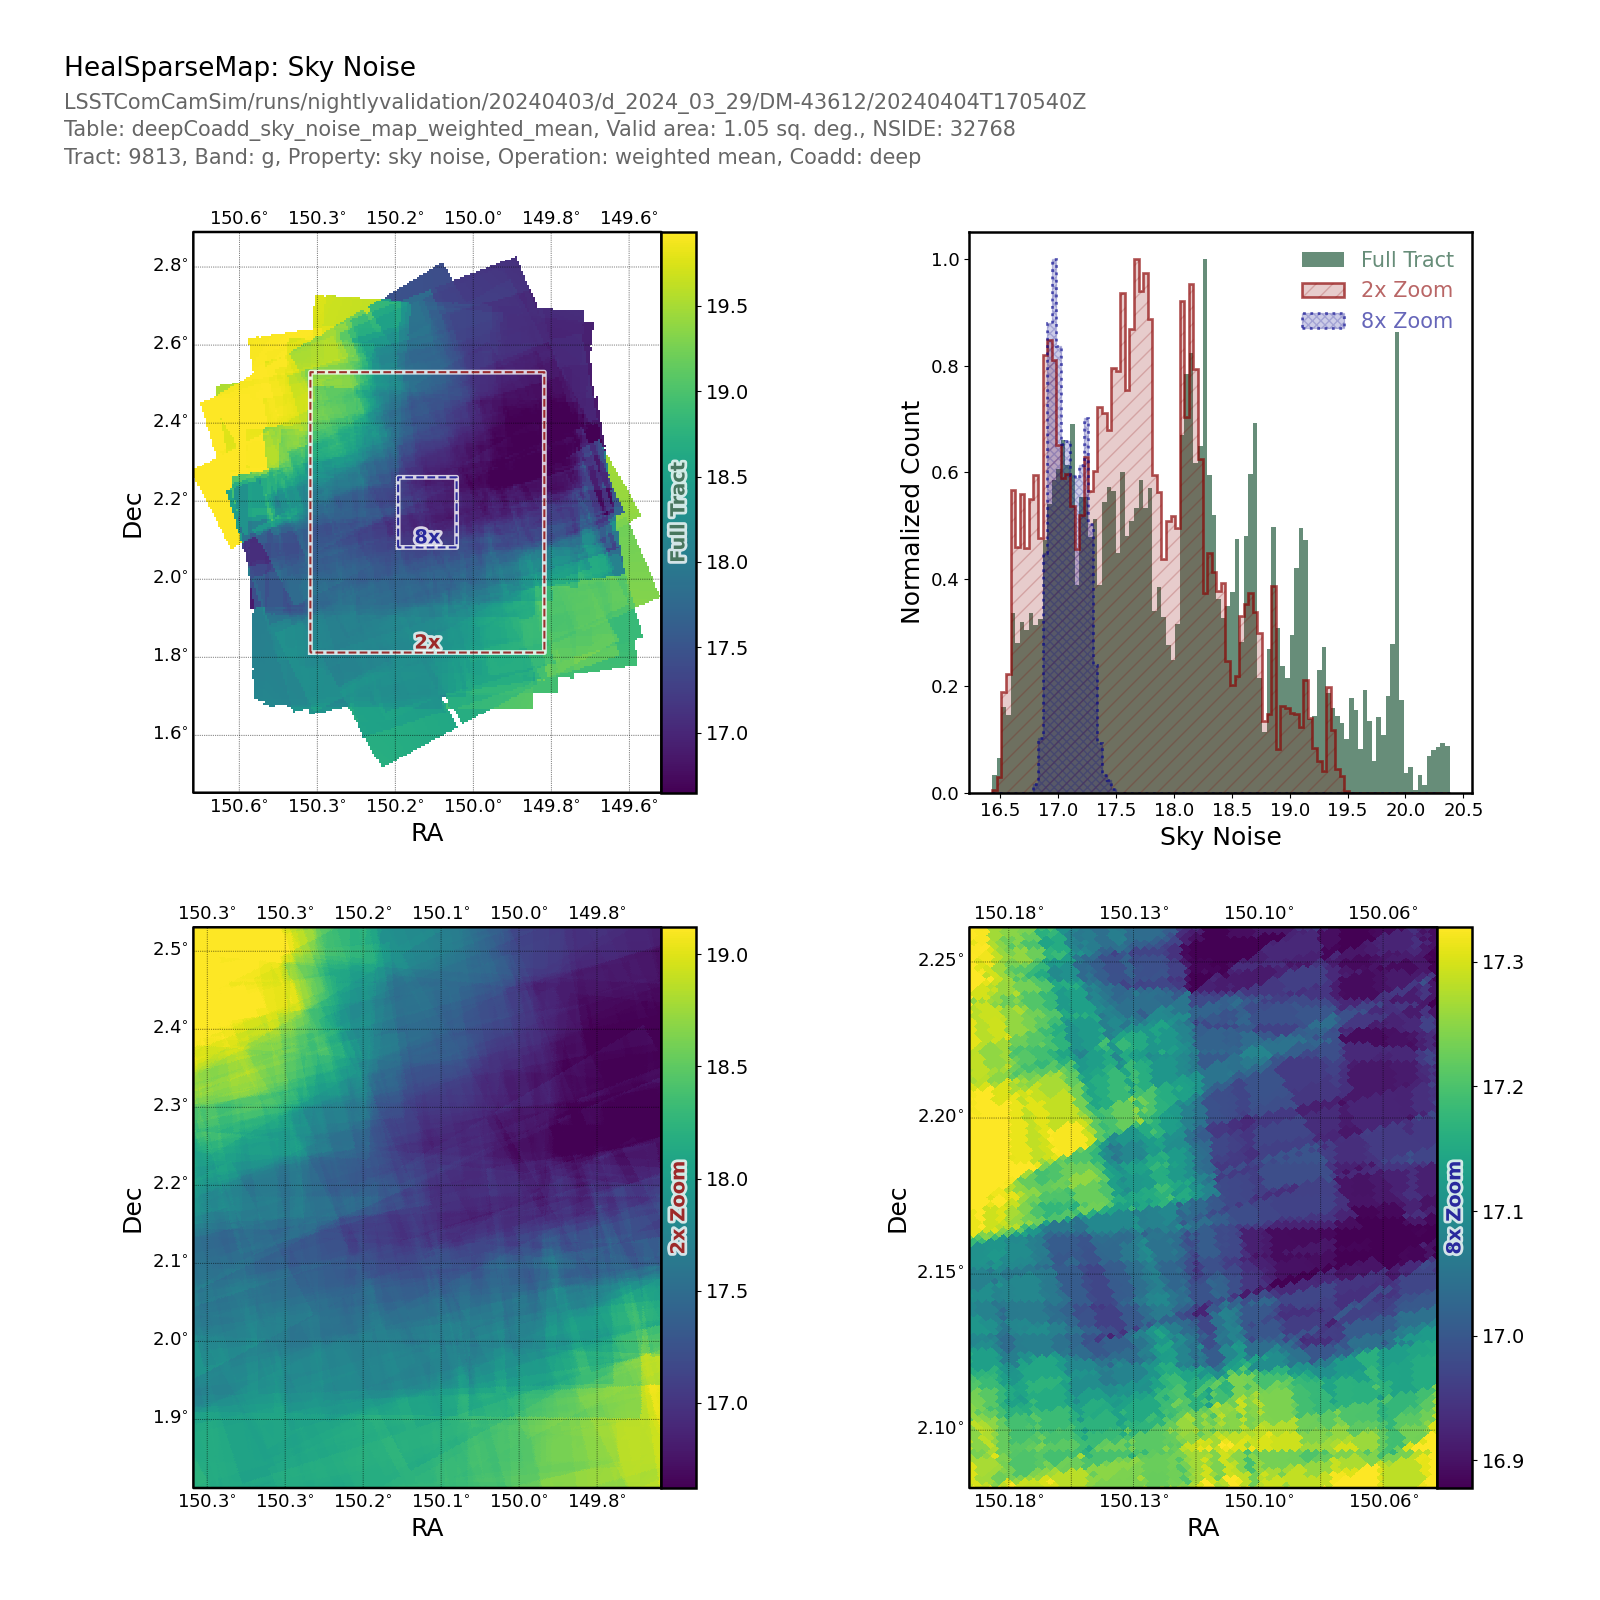
Fig. 34 Plot Name: propertyMapTract_HealSparseMap_deepCoadd_sky_noise_weighted_mean_PropertyMapPlot#
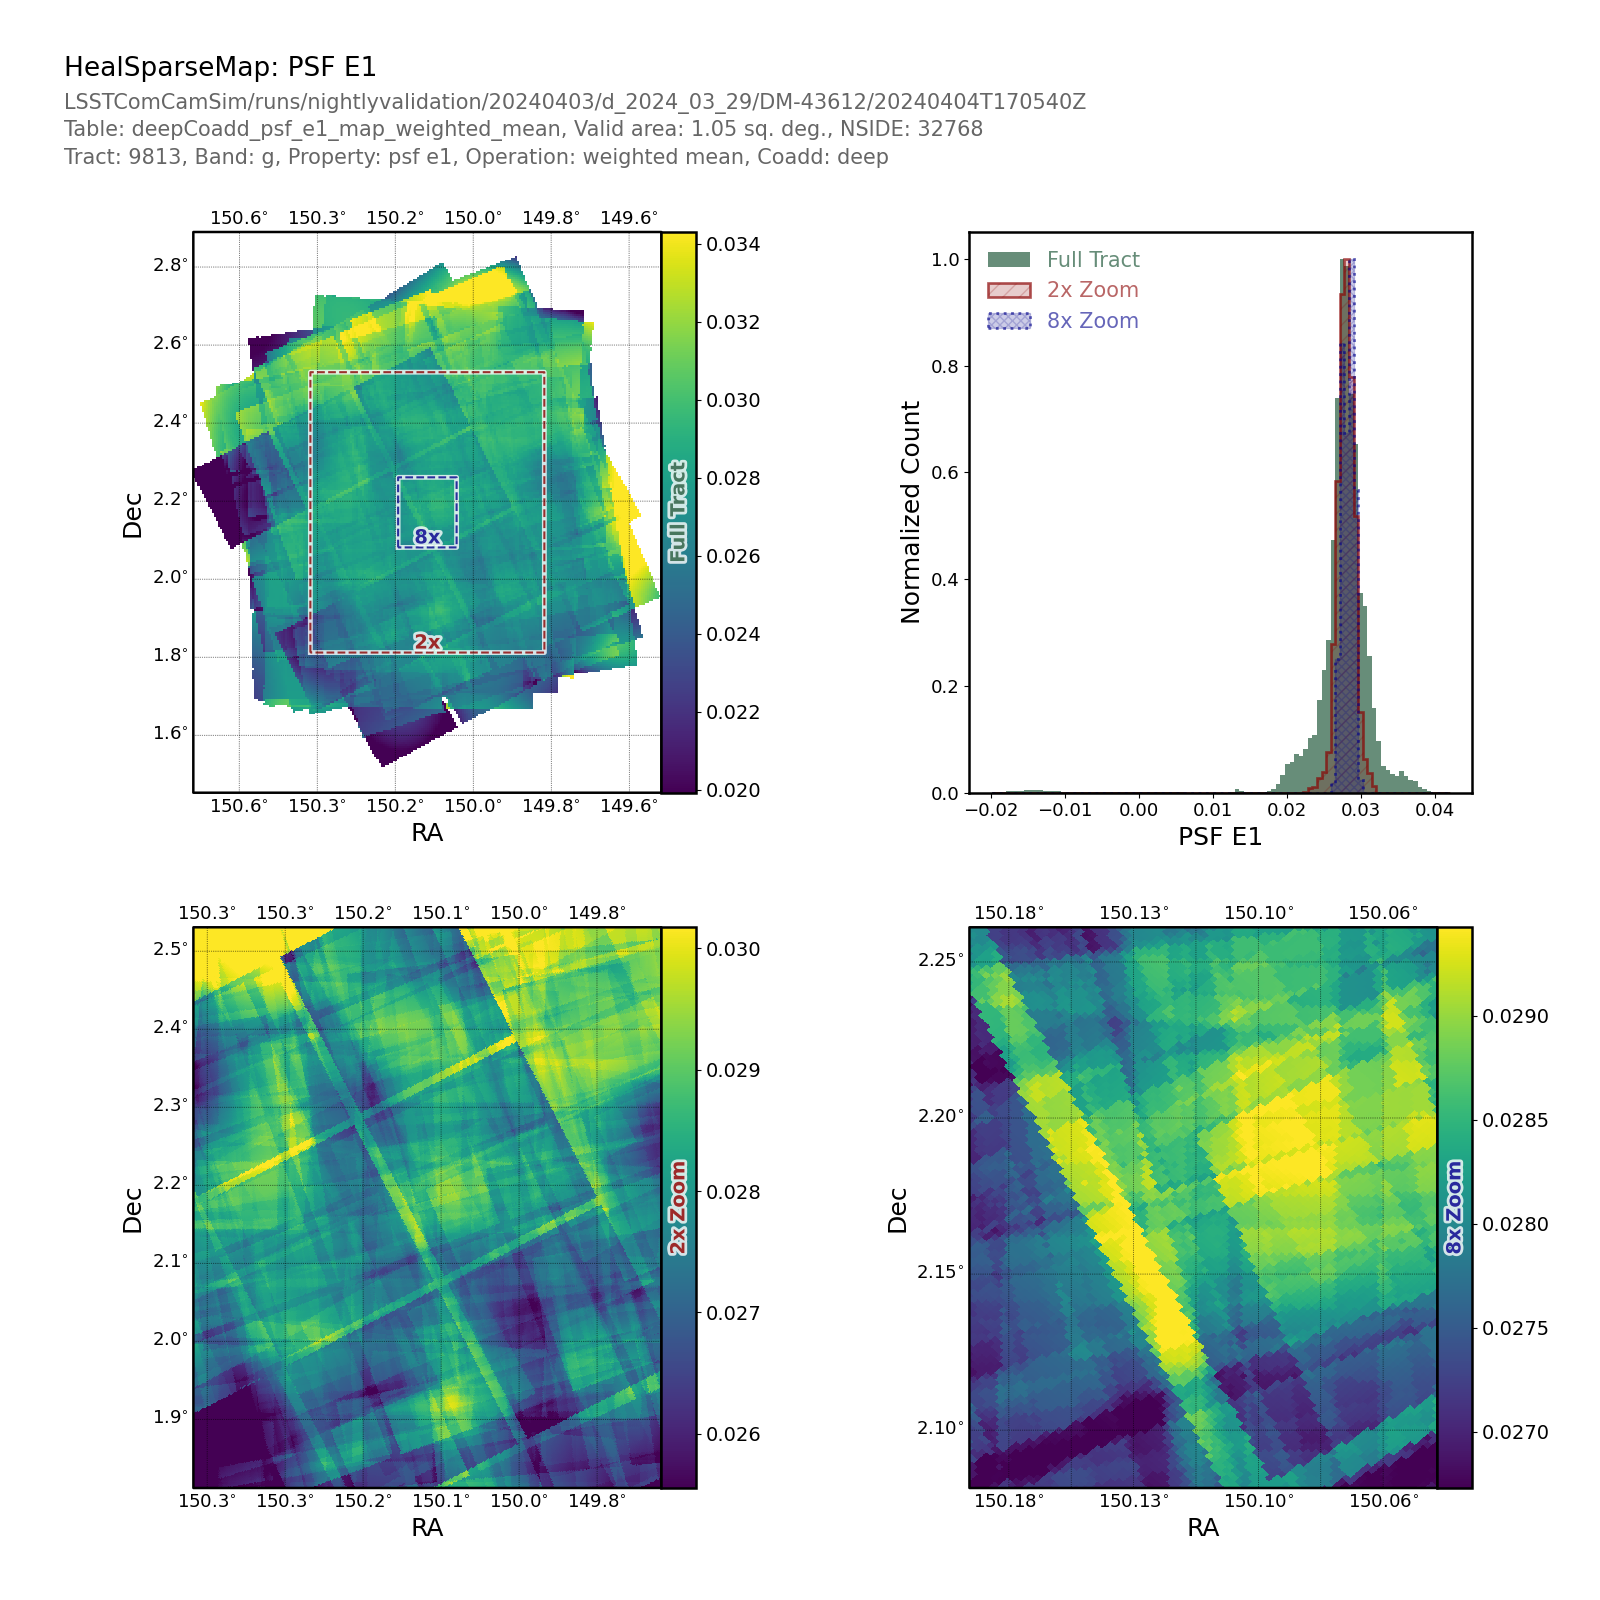
Fig. 35 Plot Name: propertyMapTract_HealSparseMap_deepCoadd_psf_e1_weighted_mean_PropertyMapPlot#
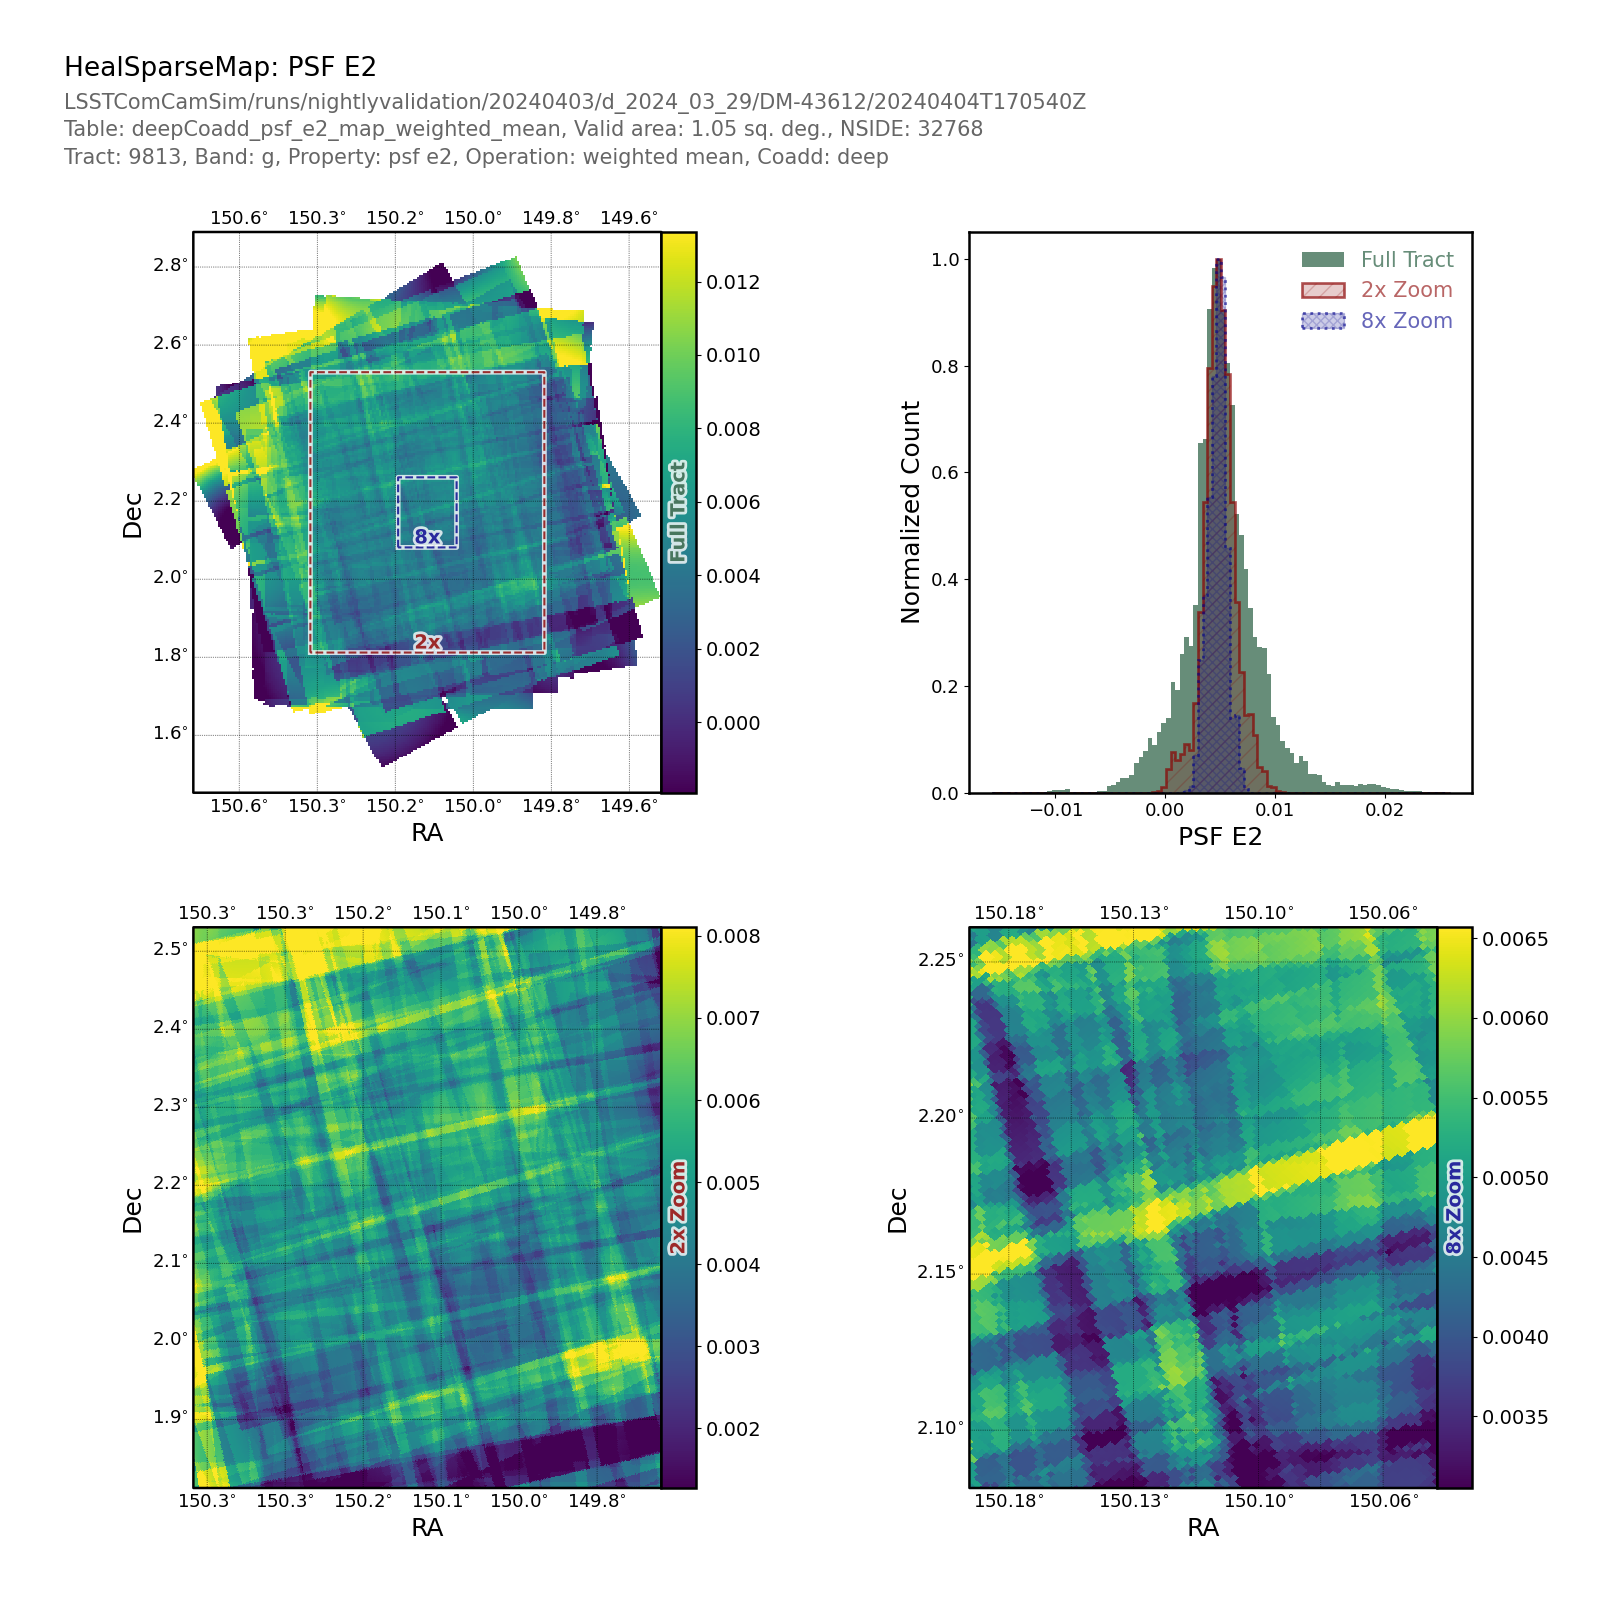
Fig. 36 Plot Name: propertyMapTract_HealSparseMap_deepCoadd_psf_e2_weighted_mean_PropertyMapPlot#
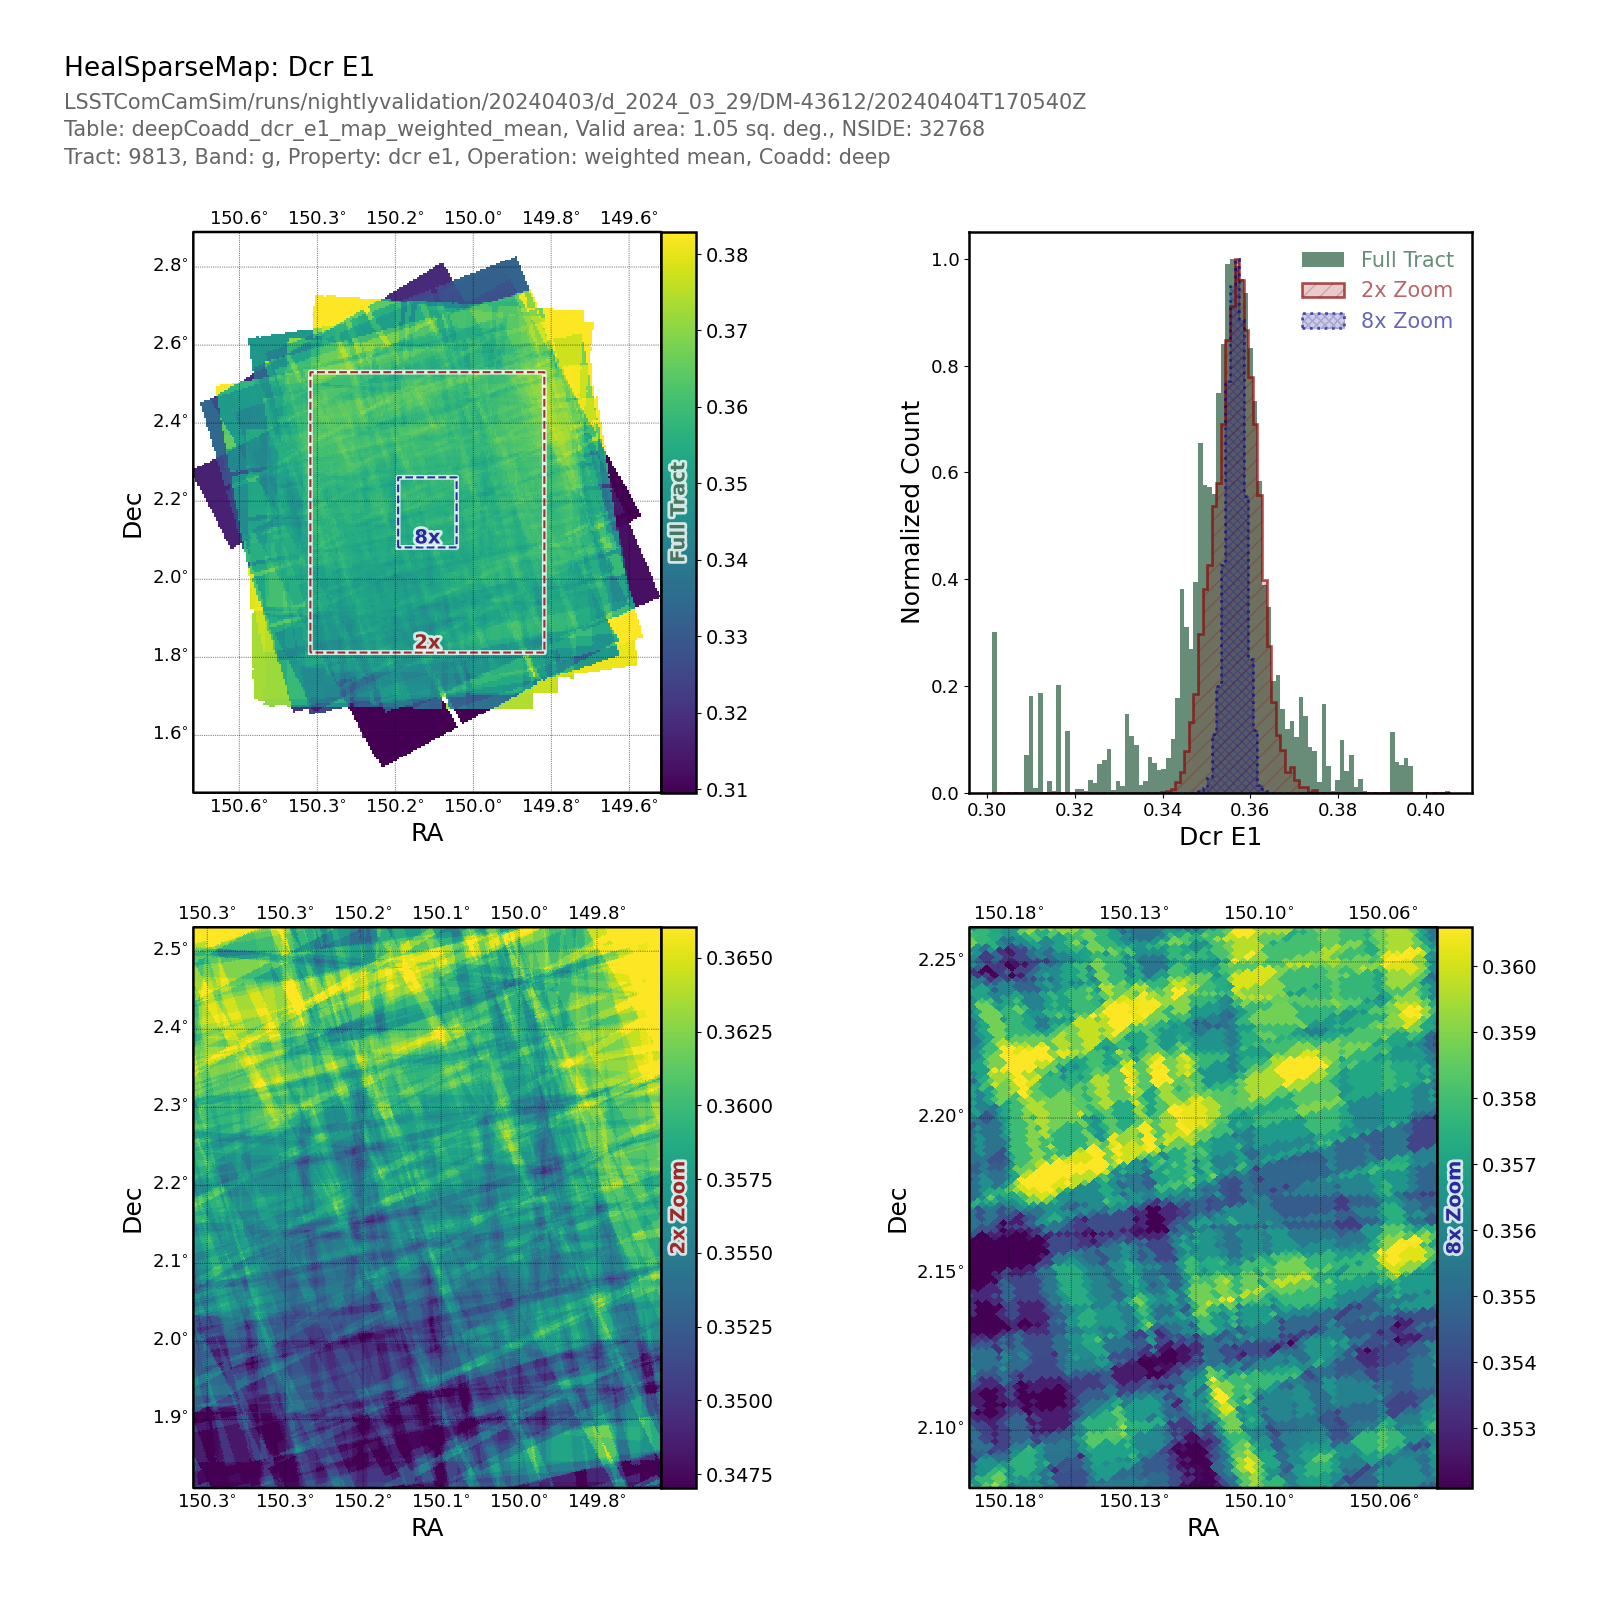
Fig. 37 Plot Name: propertyMapTract_HealSparseMap_deepCoadd_dcr_e1_weighted_mean_PropertyMapPlot#
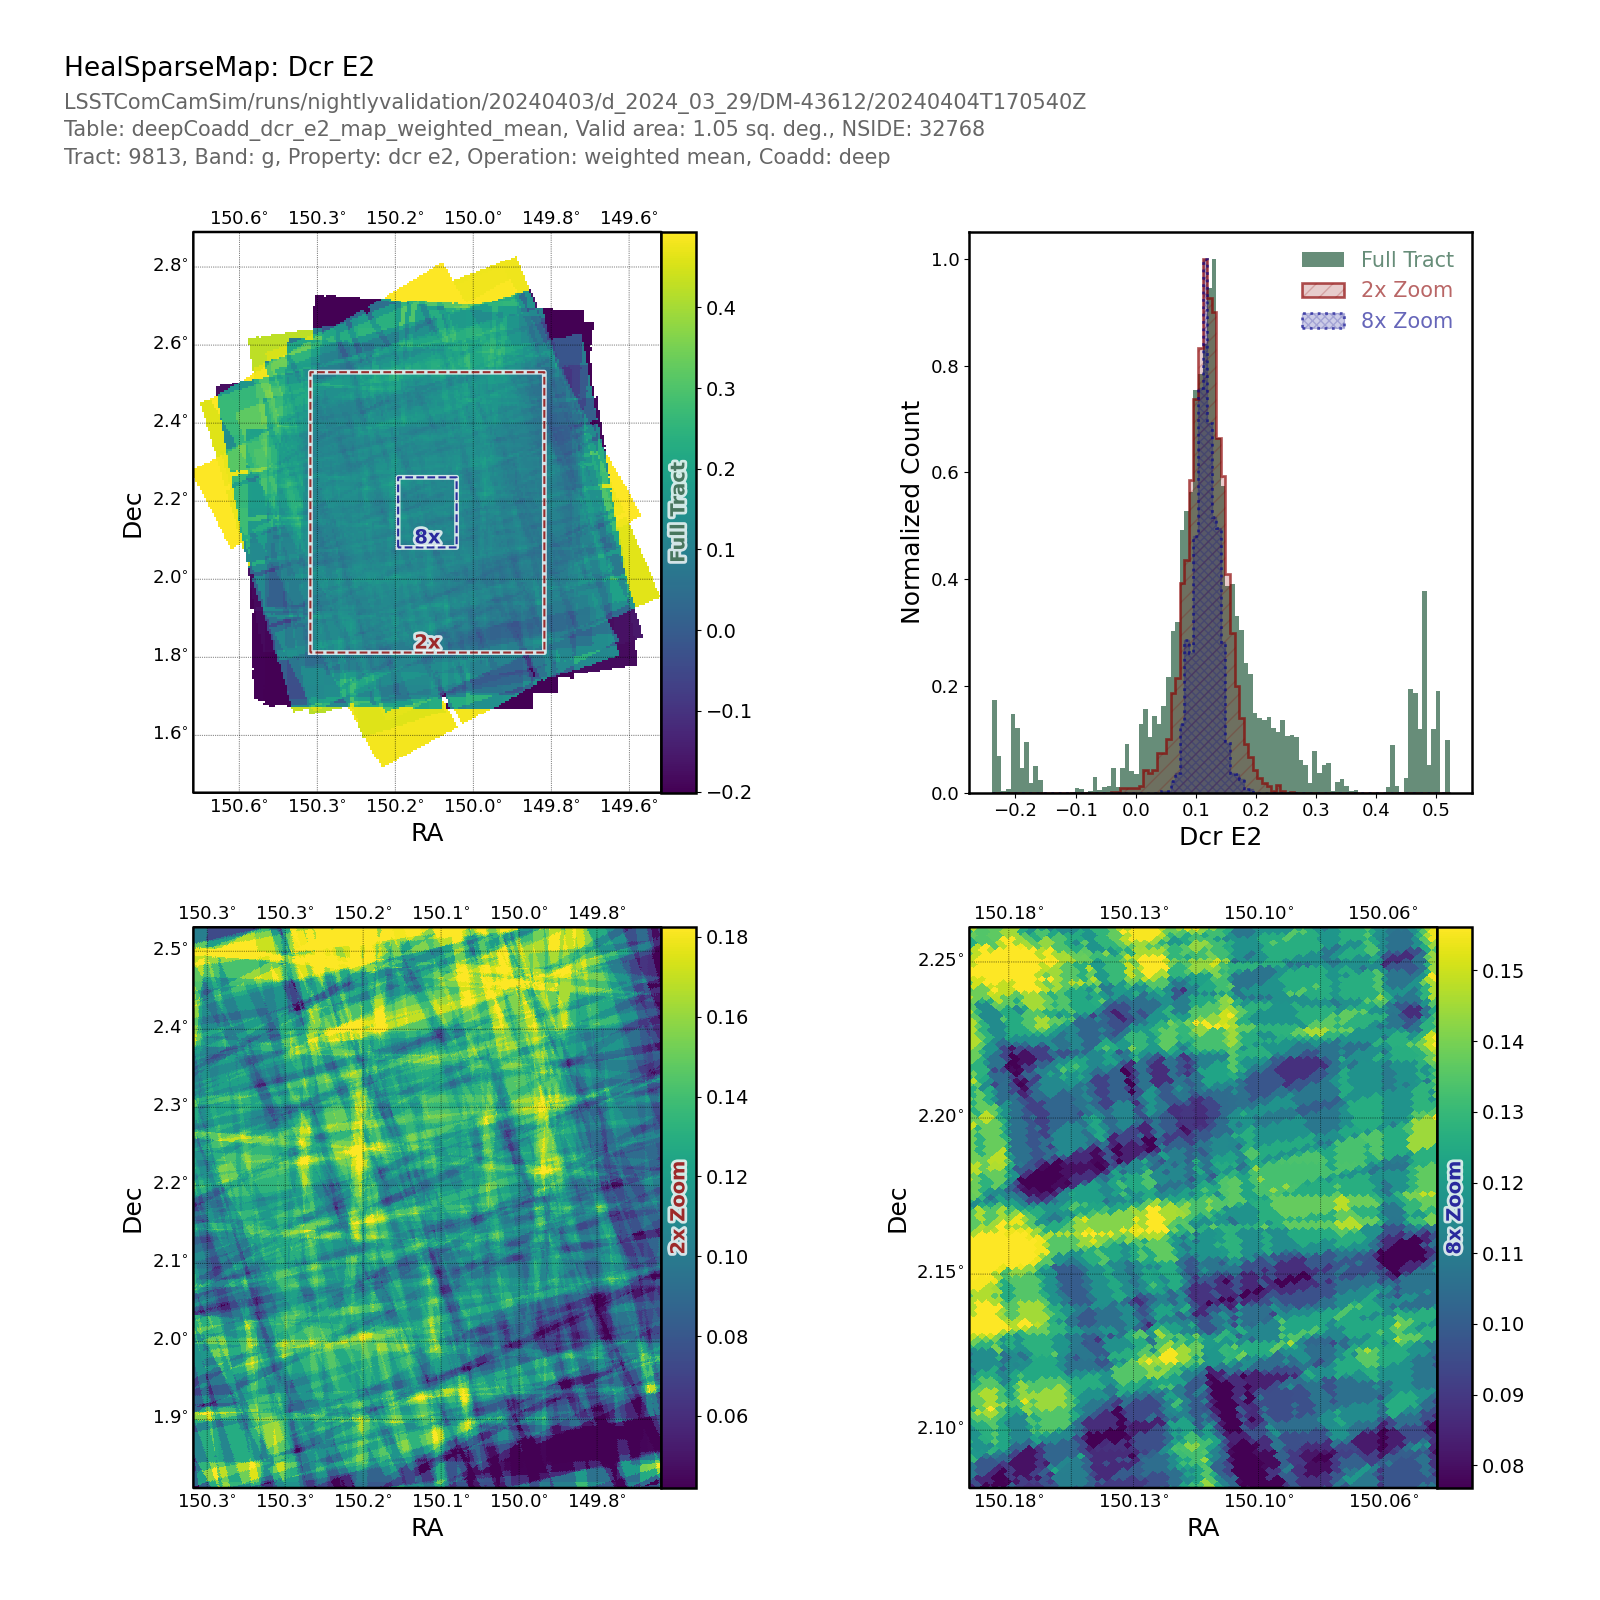
Fig. 38 Plot Name: propertyMapTract_HealSparseMap_deepCoadd_dcr_e2_weighted_mean_PropertyMapPlot#
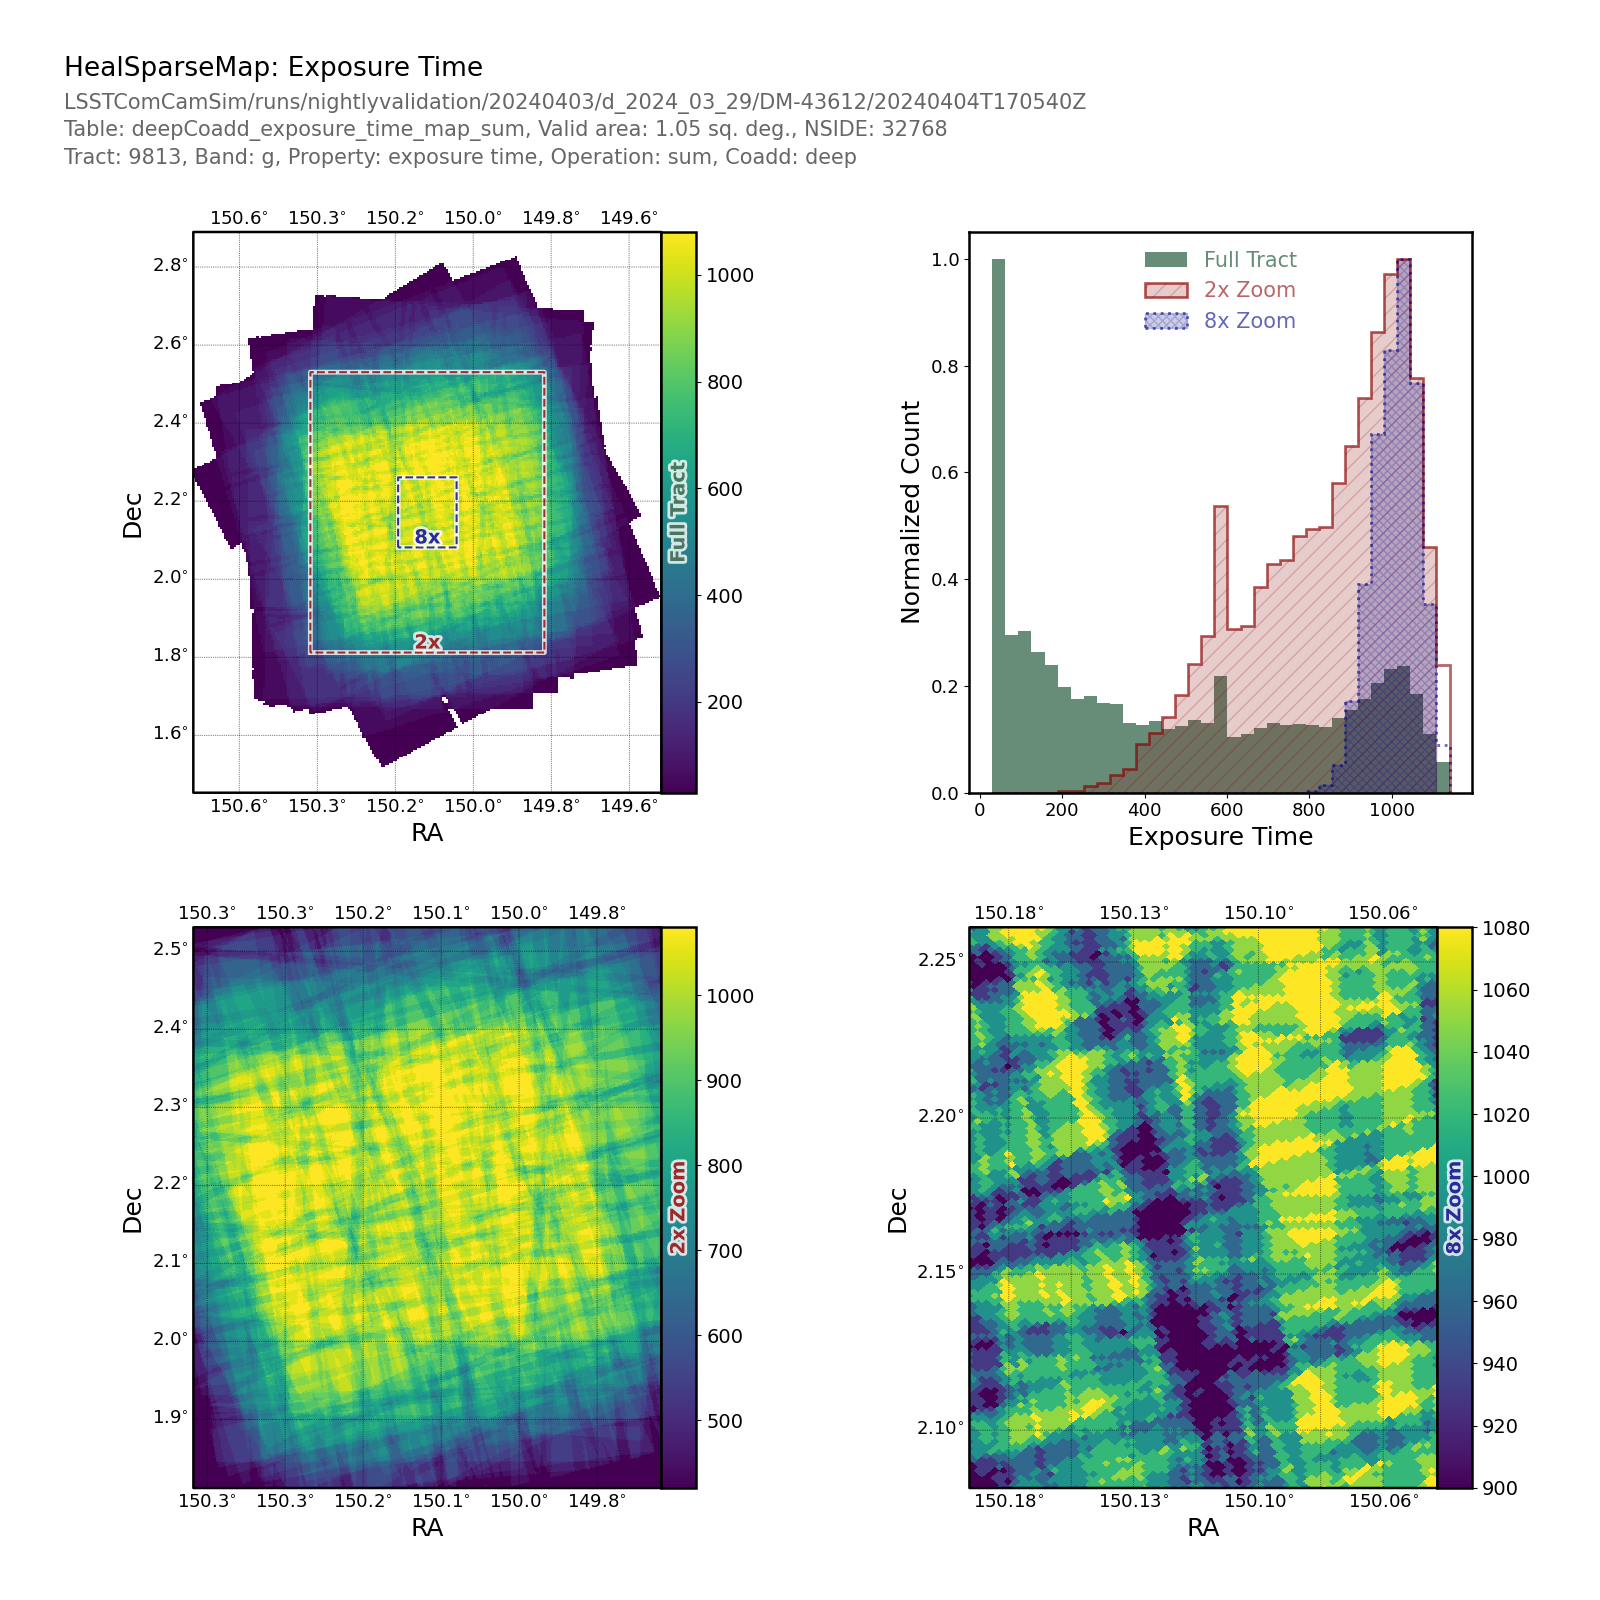
Fig. 39 Plot Name: propertyMapTract_HealSparseMap_deepCoadd_exposure_time_sum_PropertyMapPlot#
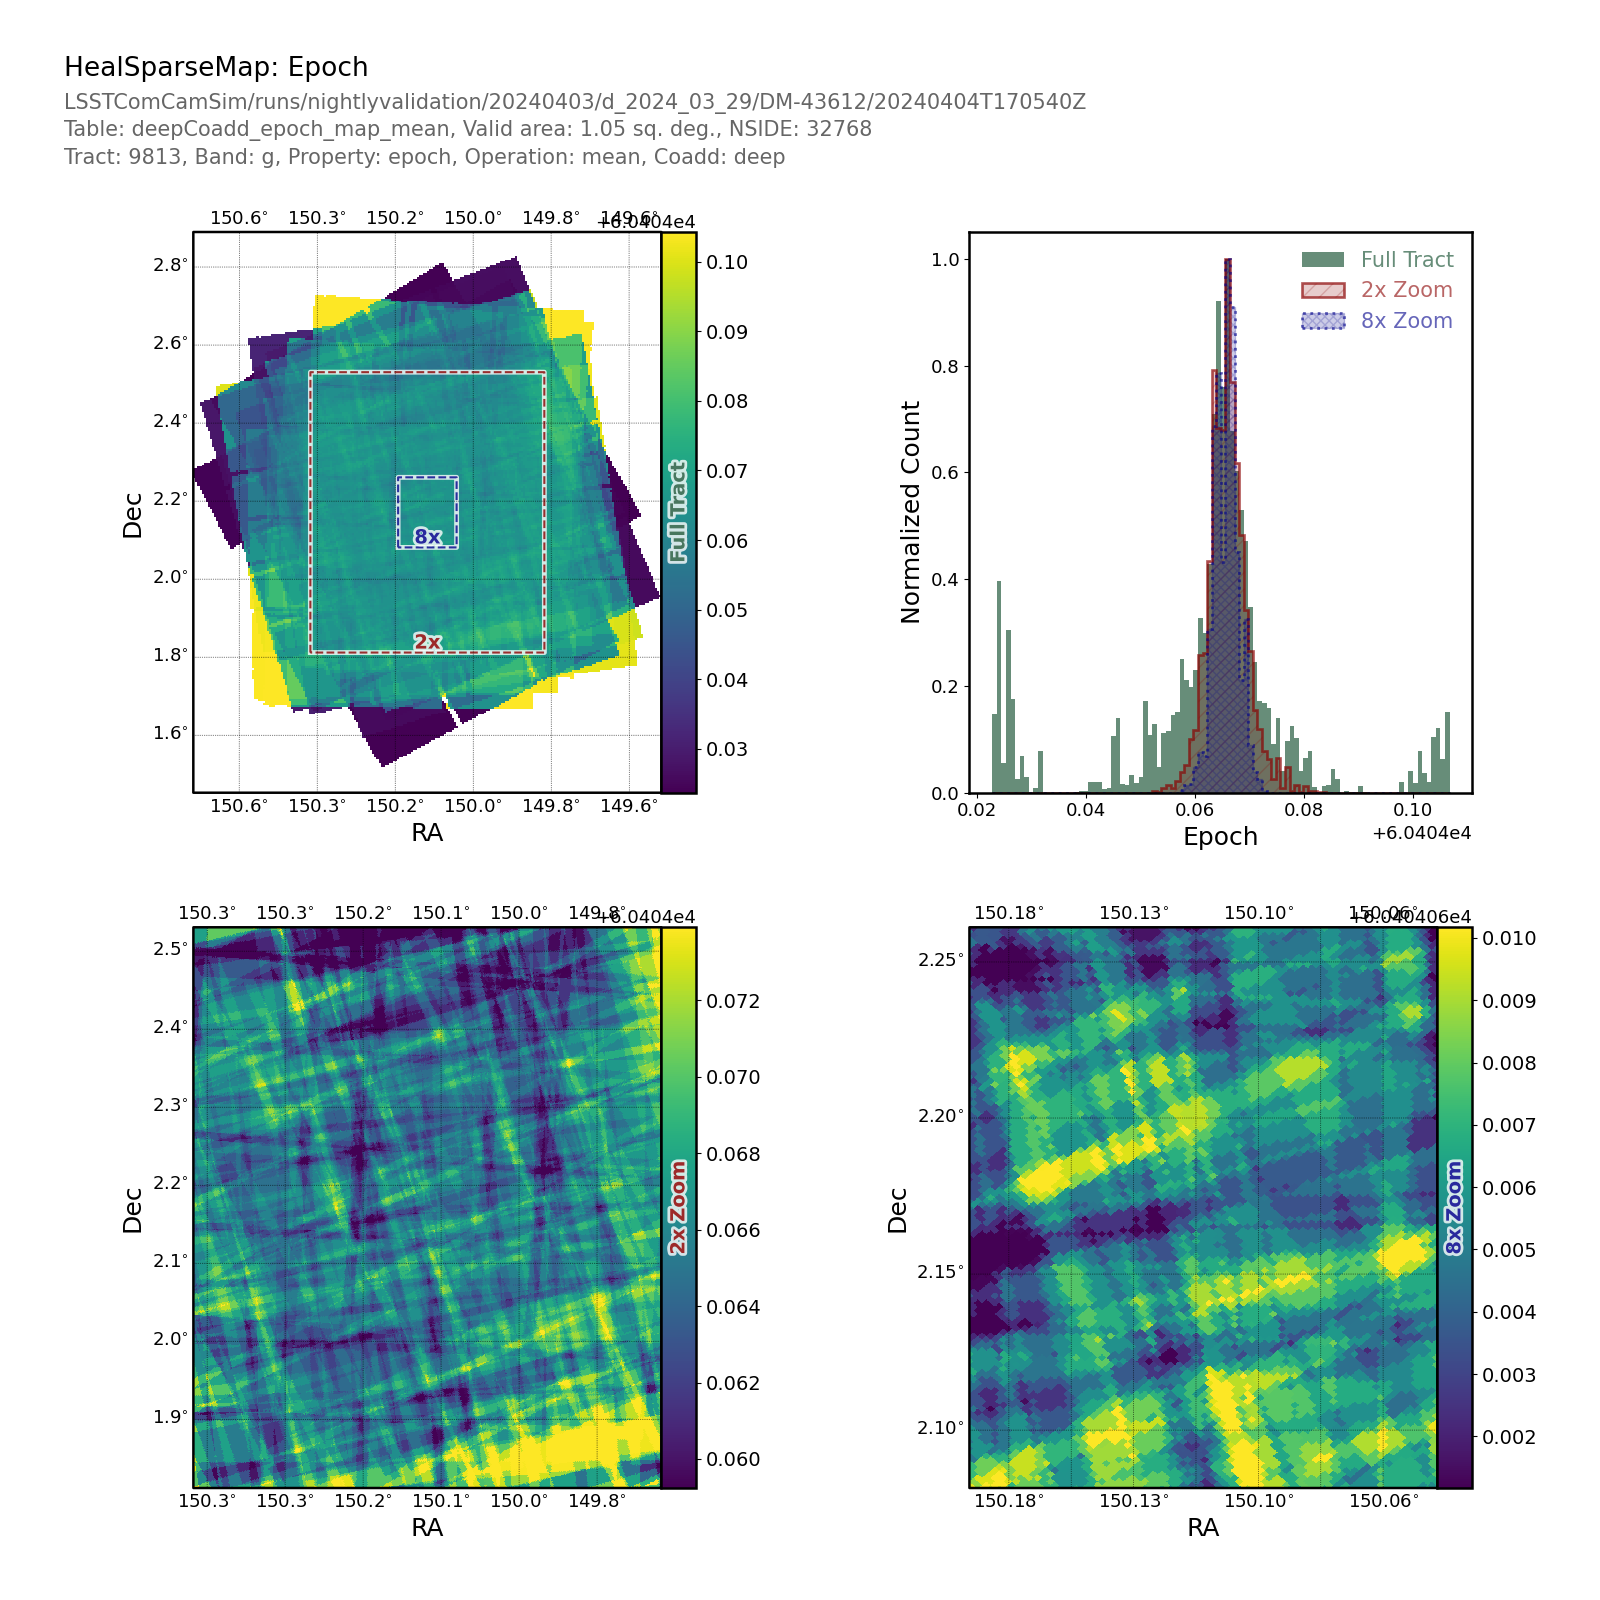
Fig. 40 Plot Name: propertyMapTract_HealSparseMap_deepCoadd_epoch_mean_PropertyMapPlot#
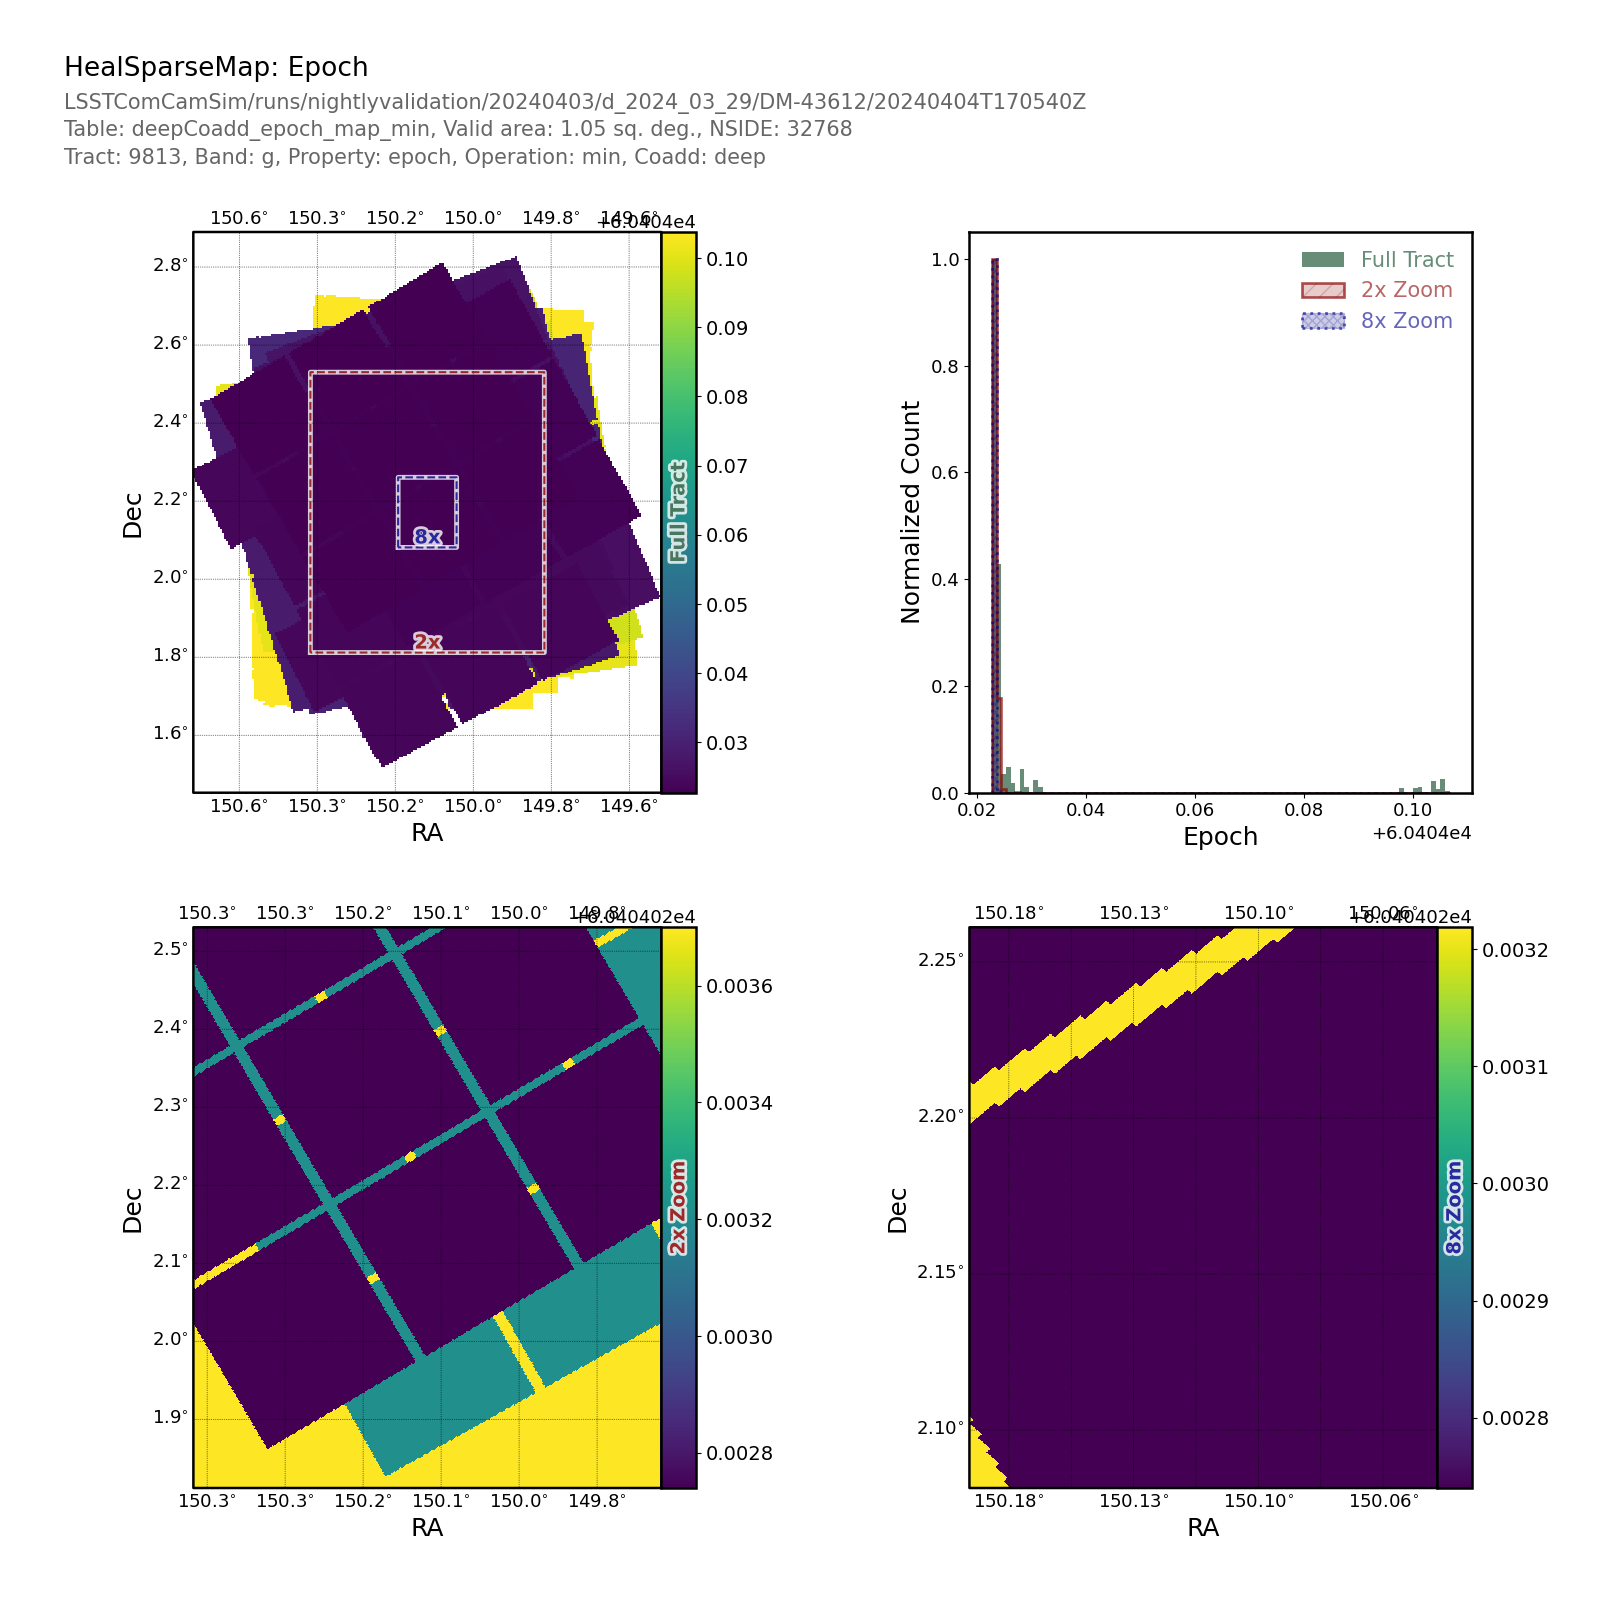
Fig. 41 Plot Name: propertyMapTract_HealSparseMap_deepCoadd_epoch_min_PropertyMapPlot#
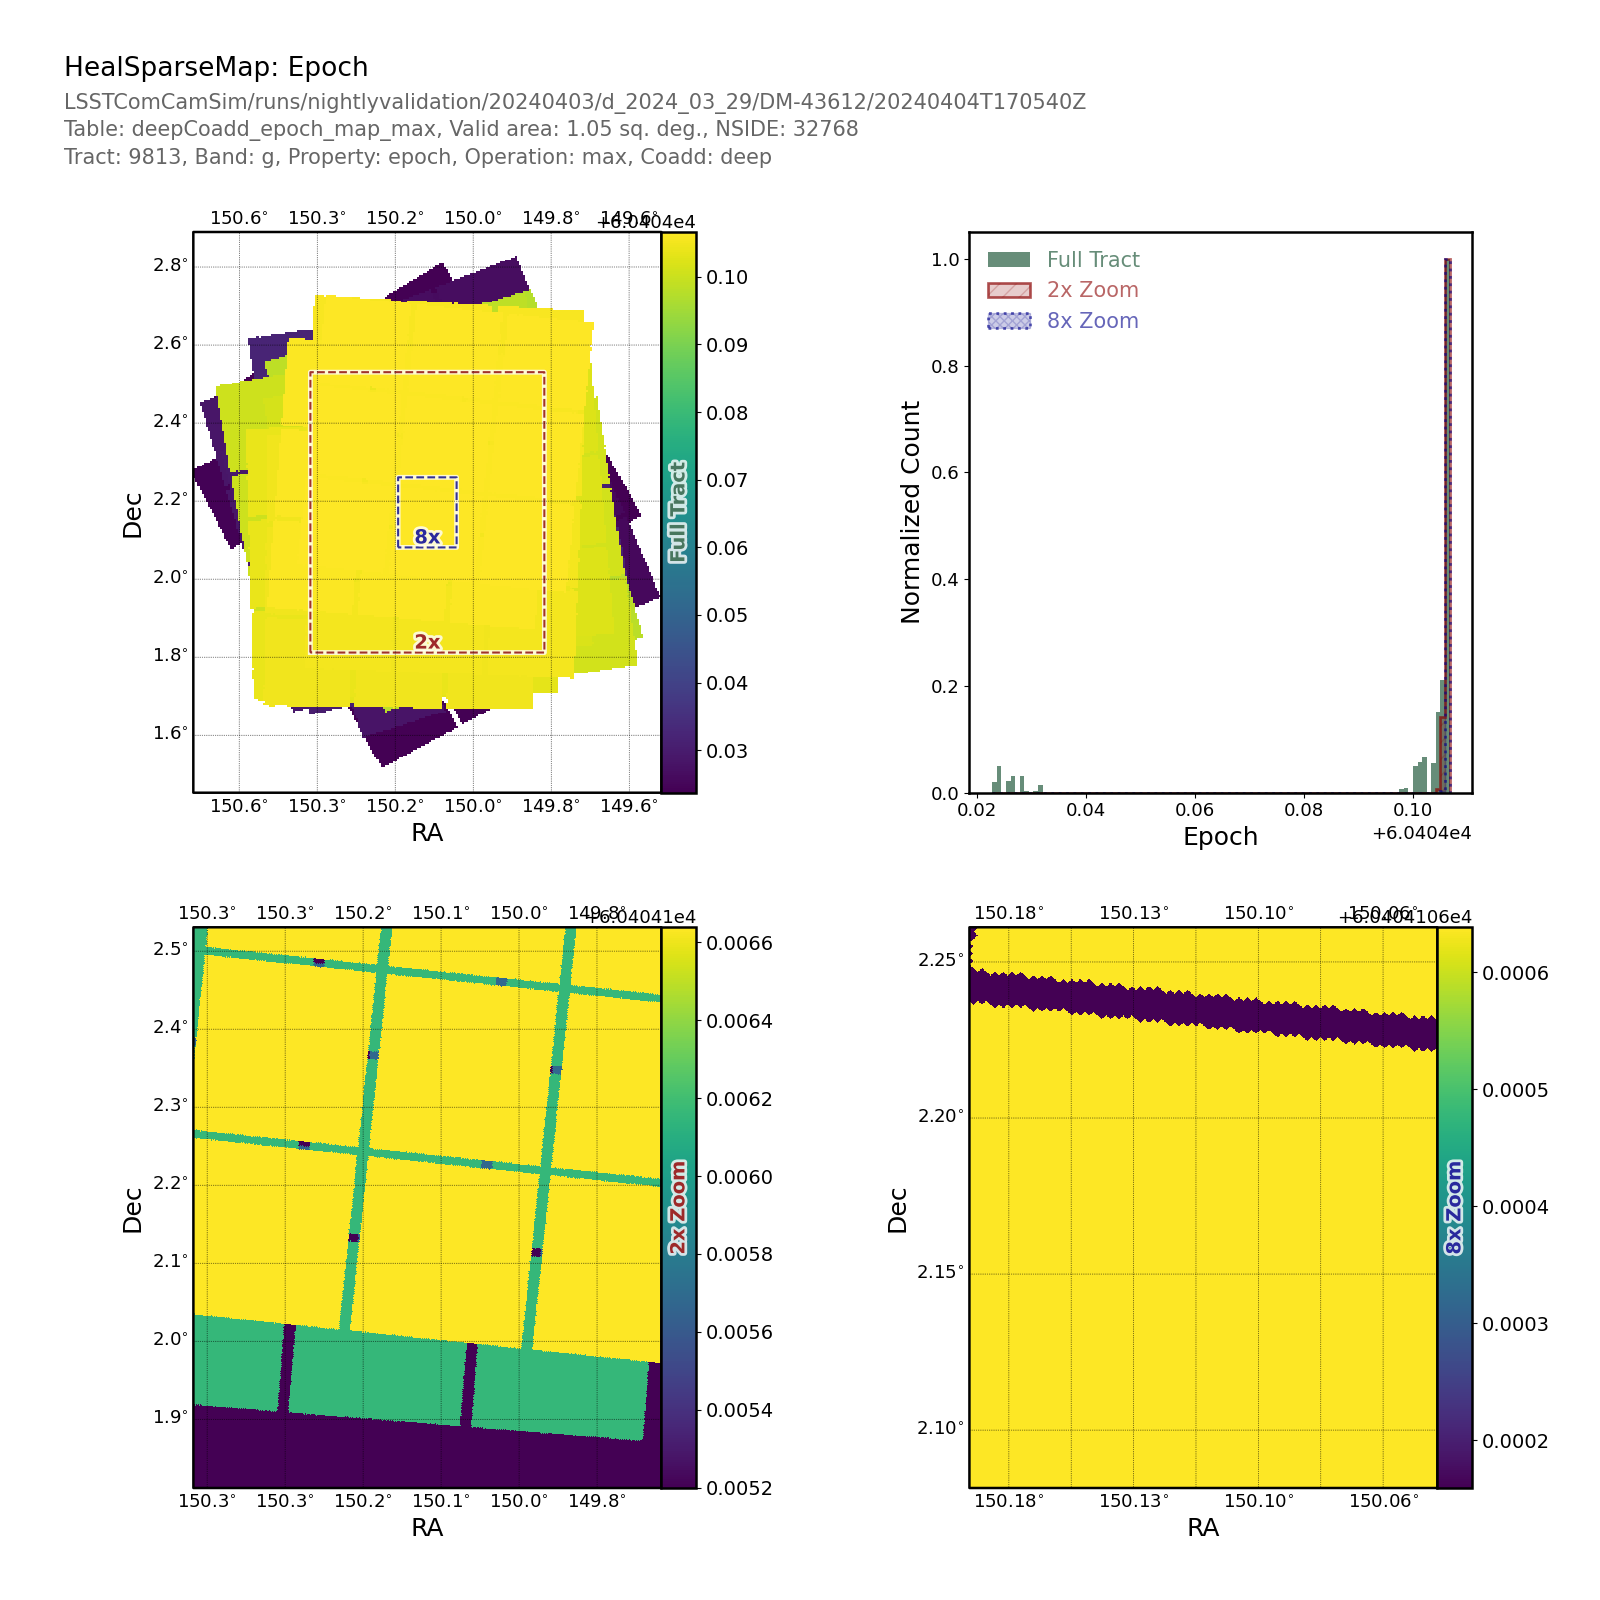
Fig. 42 Plot Name: propertyMapTract_HealSparseMap_deepCoadd_epoch_max_PropertyMapPlot#
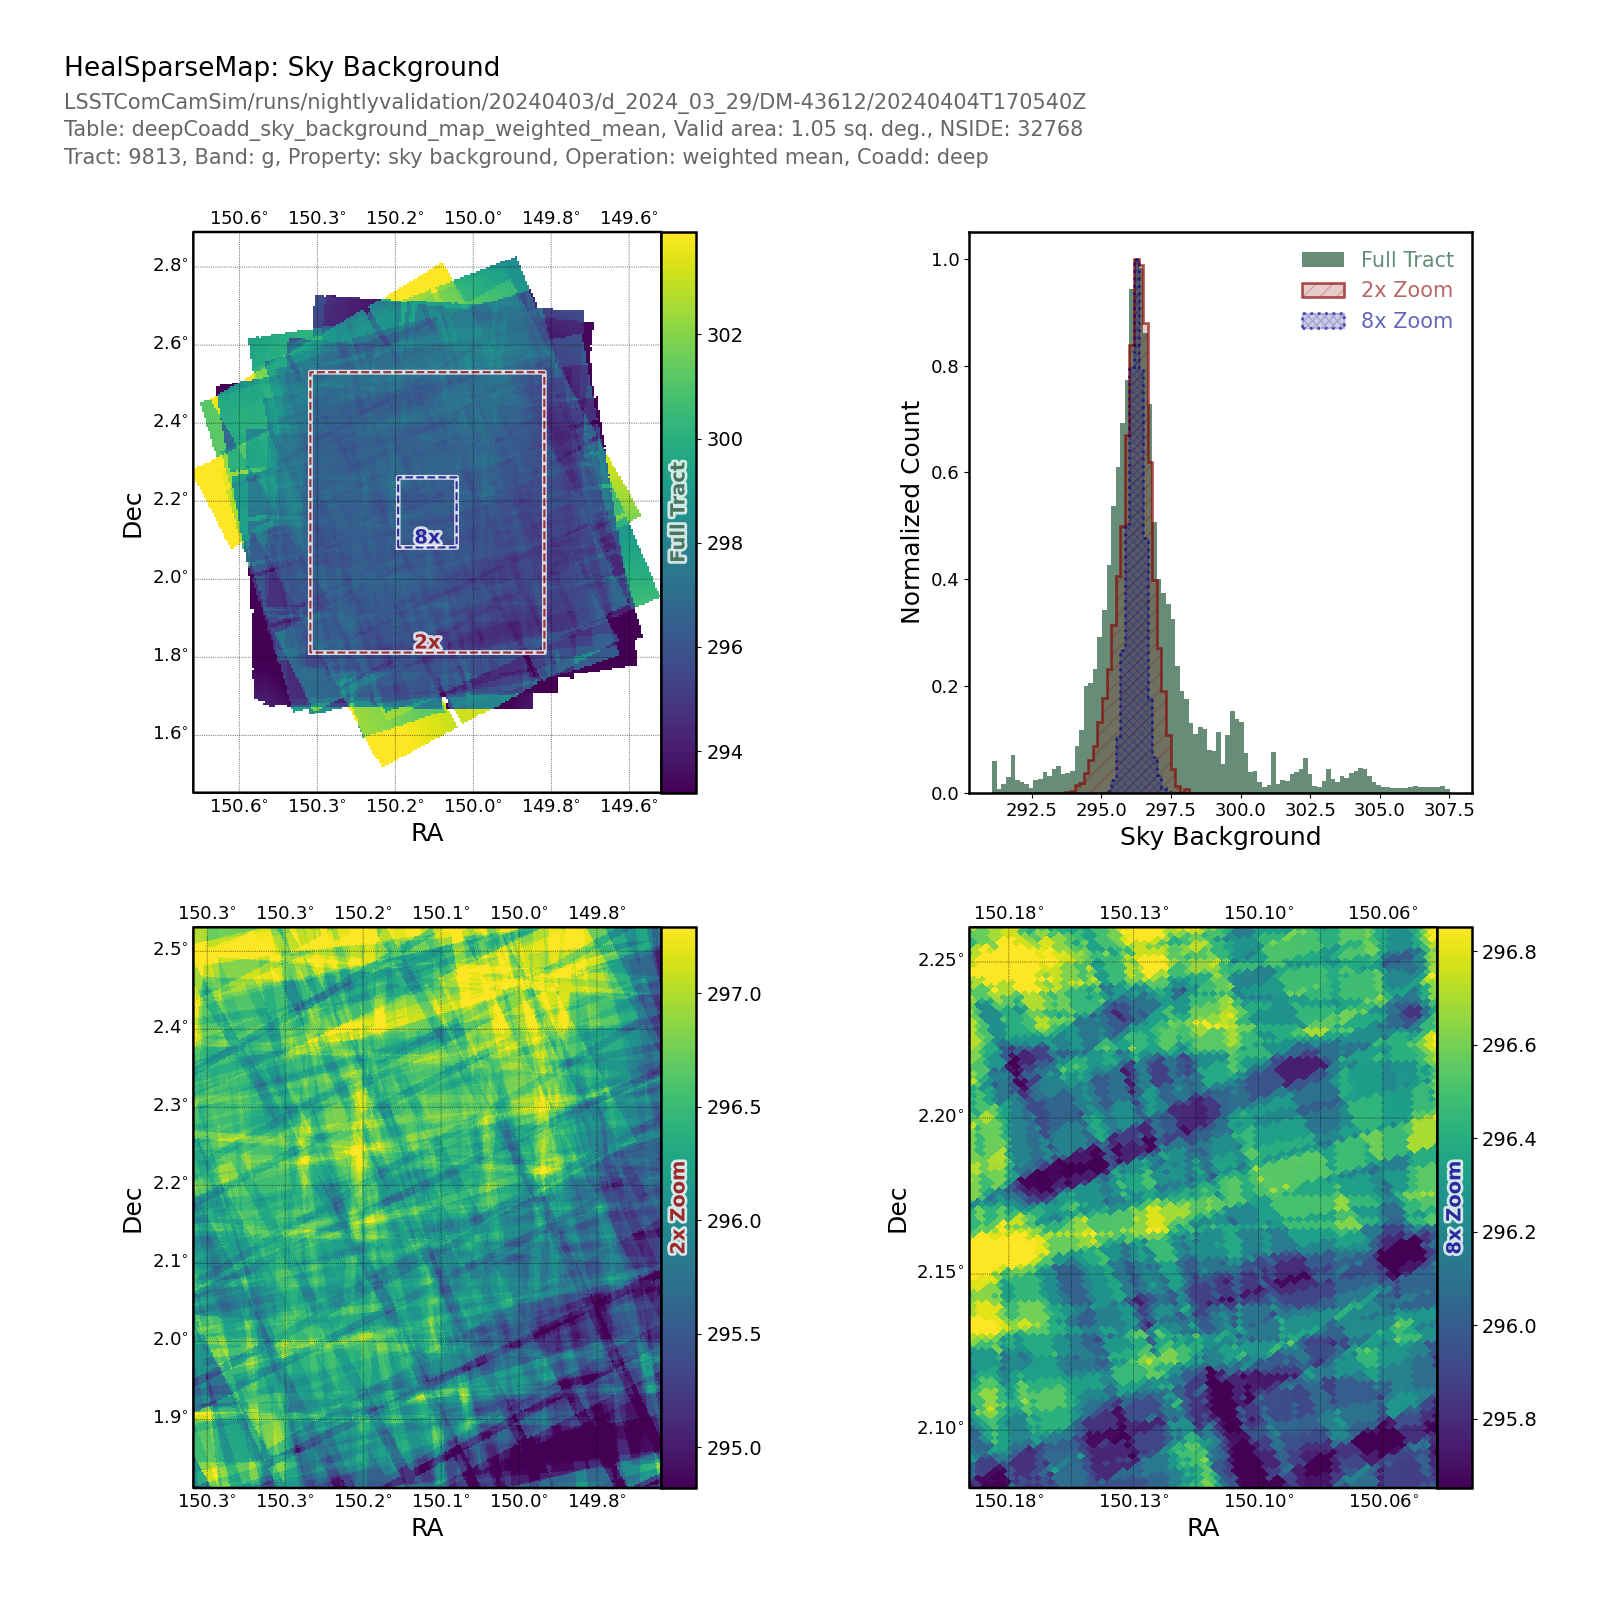
Fig. 43 Plot Name: propertyMapTract_HealSparseMap_deepCoadd_sky_background_weighted_mean_PropertyMapPlot#